Introduction
No policy is made in a vacuum. Accordingly, when looking at any policy, officials should consider the larger impact on health by consulting the affected communities and stakeholders. This is considered a Health-in-All-Policies approach. This integrated, collaborative approach considers health, sustainability, and equity in policies and actions that are made across sectors. To this end, governmental agencies should collaborate with the community to identify shared goals, harmonize activities, maximize resources, and invest in solutions that benefit all residents – while of course taking into account funding considerations and policy tradeoffs.
This report explores the importance of operationalizing health in Utahn’s decision making as we seek to build healthier communities. It also outlines current barriers to outdoor physical activity and offers evidence-based recommendations and successful case studies. The report is a guide to walk community members and leaders through examples of what has helped other communities increase physical safety and security, physical activity, community cohesion, and overall community wellness. As there is no “one size fits all” approach to a healthy community, a Health-in-All-Policies approach can help to ensure that health is at the forefront of all decisions as cities and towns develop and grow in unique ways.
Report Structure
This report is composed of two main policy solutions sections: Health & Wellness and the Built Environment. Each section seeks to find solutions to problems related to wellness: physical activity, mental health, social connectedness, health equity, and the built environment. The report highlights certain Utah-based interventions. Finally, the report includes a discussion of how communities can incorporate health in decision making.
The Problem
Wellness involves incorporating healthy habits into daily life to achieve improved physical and mental well-being, allowing an individual to thrive rather than merely survive. There are several dimensions of overall wellness: social connectedness, exercise, nutrition, sleep, and mindfulness. Each of these dimensions impact physical and mental health.
Attempting to achieve overall wellness means tackling physical and mental health challenges. A lack of physical activity and social connectedness exacerbates these challenges. In addition, health equity – both physical and mental – points to social problems for many Utahns. These issues all tie into how the built environment fails to provide active transportation or human-powered mobility. Activities like walking and biking are especially limited when roads and sidewalks are unsafe.
Physical Activity
A 2022 national survey shows that nearly 82% of Utah’s adult population self-reported as physically active outside of their regular job. The amount of physical activity recommended for adults is at least 150 minutes of moderate-intensity activity or 75 minutes of vigorous-intensity activity per week. Only 55% of adult Utahns met this requirement. This matters because a lack of physical activity can lead to high blood pressure, heart disease, obesity, diabetes, anxiety, depression, poor bone health, and other chronic illnesses and diseases. Despite Utahns self-reporting as being active, the Utah Department of Health finds that 29% of adults and 11% of grade school children in Utah were considered obese in 2020. The trend projects that by 2050, 46% of Utahns will be obese.
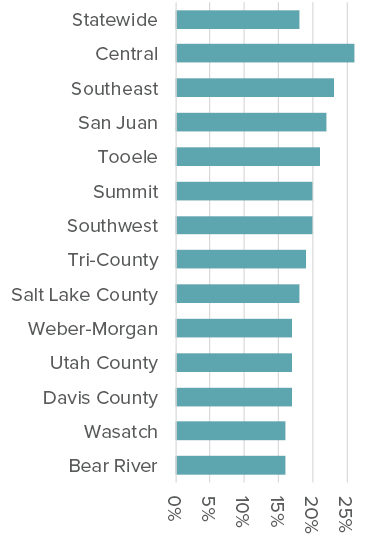
An estimated 9% of Utah high school students are considered obese, with boys being twice as likely to be obese than girls (13% compared to 6%). This may be due in part to a lack of physical activity. Only 18% of Utahns in grade 8, 10, and 12 are getting the recommended amount of physical activity, which is at least one hour of daily activity that increases their heart rate and makes them breathe faster. The percentage varies by area, with Central Utah students seeing the highest level of physical activity and Wasatch County students seeing the lowest. (See Figure 1.)
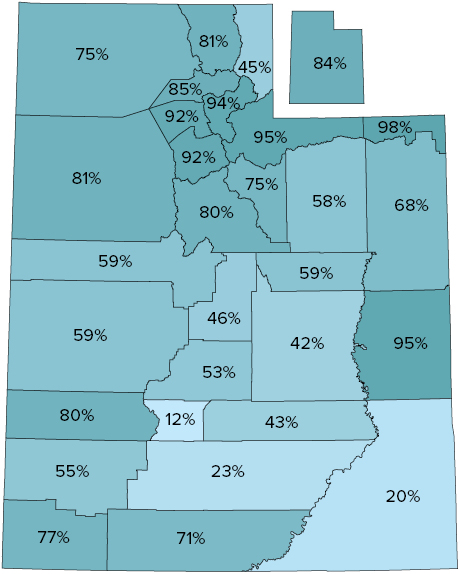
Access to locations for physical activity is important. The 2023 County Health Rankings suggest that 84% of Utahns live near a park or recreation facility. However, that accessibility varies widely across Utah’s counties – from 12% to 98%. (See Figure 2.) Those who can easily access green space, such as parks and trails, tend to already be more physically active than those with less access.
Physical inactivity costs an estimated $24.7 billion in direct health care expenditures and another $3.1 billion in reduced productivity in the U.S. When individuals who are considered inactive take part in physical activity, they can save an estimated $3 on annual healthcare costs for every mile they walk and about $0.75 for every mile they bike. Similarly, a North Carolina study found an estimated savings of $12.6 million over nine years in healthcare costs for obese transit riders using the state’s new light-rail system. These savings came from the physical benefits of walking to and from the train instead of driving directly to their destinations.
Mental Health and Social Connectedness
Being active and participating in healthy activities outside of the home can foster a sense of community and social connectedness. Social connectedness is when an individual has relationships that create a sense of belonging and being cared for, supported, and valued. Studies show that a lack of social connection is worse for health than obesity, smoking, and high blood pressure.
Commuting long distances hurts social ties and quality of life. Researchers who have studied the effects of commuting on wellbeing found that individuals with one-hour commutes report significantly lower wellbeing and feel the need to make more money to make up for their longer commutes. The social costs incurred by long commutes (45 minutes or more) might paradoxically outweigh the financial benefits of the jobs to which people are commuting. For example, studies show that people who have a long-distance commute are more likely to divorce (14%) than their counterparts with shorter commutes (10%).
Further, walking boosts the production of endorphins that counteract stress, improve sleep, increase self-confidence, and reduce the symptoms of depression. Those who walk for more than 8.6 minutes a day are 33% more likely to report better mental health.
Increased physical activity could particularly benefit the approximately 31% of Utahns who report having an anxiety disorders or major depressive disorders. Utah consistently has higher death by suicide rates than the rest of the nation – ranking 6th in 2021. The Utah suicide rate is 20.1 per 100,000, compared to the national rate of 13.5. Further, the 2021 Utah Youth Risk Behavior Survey reported that in the 12-month period before the survey, 42% of high school students had felt sad or hopeless, 23% seriously considered suicide, 18% made a suicide plan, and 9% attempted suicide one or more times. There is a serious need for community connectedness and an increase in opportunities for healthy activities in Utah to combat anxiety, depression, and suicide. (If you or someone you know are considering suicide, please call the National Suicide and Crisis Lifeline by dialing 9-8-8 any time of day or night.)
Social connection can lower levels of anxiety and depression and raise levels of self-esteem, empathy, and trust. Social connection can even increase immunity from illness and can increase the chances of a longer life. The social benefits of walking and walking-friendly environments include increased social interactions, development of social capital, and an increased feeling of safety. Community connections can grow from dog park friends, a community garden membership, trail-running partners, or simply seeing familiar faces while walking around the neighborhood or a shopping center.
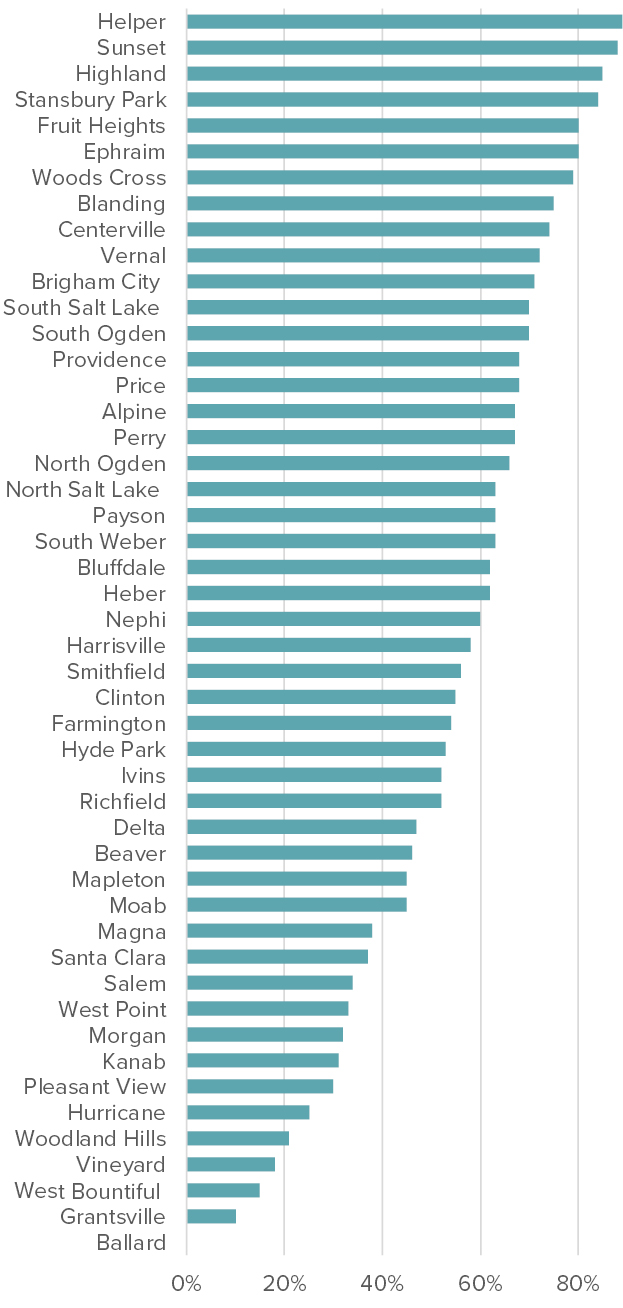
Utah State University’s Utah Wellbeing Project survey asked respondents to rate how connected they feel to their community. They found somewhat higher perceptions of community connectedness in rural and resort cities than in rapid growth, established, large, and mid-size cities. (See Figure 3 to compare select Utah cities and towns on this metric.)
Health Equity
An important aspect of a Health-in-All-Policies approach is increasing health equity. The Robert Wood Johnson Foundation defines health equity as follows:
Everyone has a fair and just opportunity to be as healthy as possible. This requires removing obstacles to health such as poverty, discrimination, and their consequences, including powerlessness and lack of access to good jobs with fair pay, quality education and housing, safe environments, and health care.
Or in other words, everyone has the right to live the healthiest life possible.
The Healthy People 2030 project suggests that to achieve health equity, every individual needs to be valued equally and community leaders need to prioritize efforts to address historical and current inequities and eliminate these disparities in health and health care. Achieving health equity requires acknowledging that these asymmetries exist. Health disparities are when there is a difference in health that is closely linked to economic, social, environmental, or geographic disadvantage. Health disparities are closely tied to health literacy and the social determinants of health, such as nutrition, air quality, and variability in open space access. Groups who are negatively affected by health disparities are typically those who have been historically underserved due to a lack of investment in their communities. These communities typically experience greater obstacles to health and health care due to factors such as religion, racial or ethnic group, gender, age, socioeconomic status, disability, gender identity, sexual identity, and age.
A simple example of a health disparity is life expectancy. Zip codes correlate with life expectancy in Utah. For example, the average life expectancy in the Salt Lake City neighborhoods varies greatly. The average life expectancy for people living in the Avenues neighborhood is 87 years, while for people living downtown it is 76 years – even though these neighborhoods are adjacent. Life expectancy on the east side of Sandy is 82, while it is only 78 on the west side. The highest life expectancy in Utah is in the Avenues (87); the lowest is in South Salt Lake (74). These areas are only five miles apart, but due to differences in built environment, community, education, economic stability, and healthcare access and quality, residents’ life expectancies vary widely.
Life expectancy in Utah also differs based on demographic characteristics beyond locality. For example, life expectancy at birth has a nearly 12-year difference between Asian Utahns and Native Hawaiian/Pacific Islander Utahns.
(See Figure 4.)
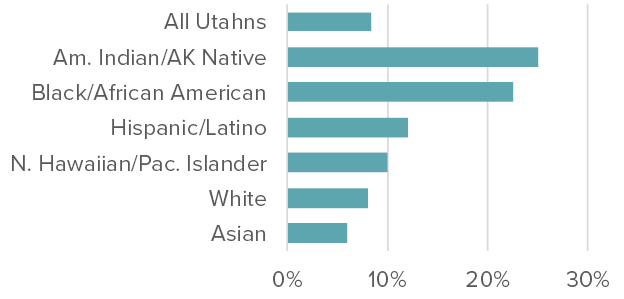
Another example of a disparity that has a direct link to health is the percentage of families living in poverty. The federal poverty level considers income and family size in its assessment of the financial resources available to households for meeting basic needs, such as food, housing, and health care, each of which greatly impacts health. Families living in rural Utah are more likely to be in poverty than families that live in urban centers. The poverty rate for rural Utahns is over 10%, compared with the 7% in urban Utah. Race is another indicator for this inequality. Rates of poverty for American Indian and Alaskan Native Utahns are 14% higher than for White, non-Hispanic Utahns. (See Figure 5.)
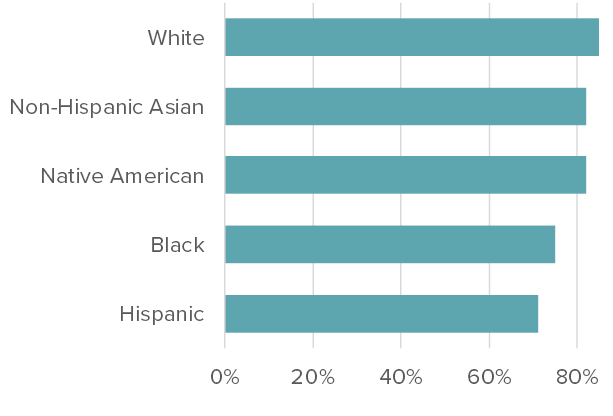
As with many other factors, poverty rates correlate with health inputs and outcomes. In terms of self-reported physical activity, rates vary greatly by race and ethnicity (see Figure 6). Hispanic/Latino Utahns report far lower activity levels than their counterparts.
Built Environment
The built environment impacts the health and safety of all Utahns. The built environment can be described as the man-made or modified structures that serves a community with living, working, and recreational spaces. The built environment touches all aspects of an individual’s life. This report focuses on transportation systems, spaces for physical activity and enjoyment, and the surrounding buildings, and how these relate to safety, health, and everyday lives of Utahns.
In 2022, Utah hit a twenty-year high in bicycle casualties with 15 deaths and 49 serious injuries. That same year, Utah pedestrian deaths reached 53 along with 176 serious injuries. Nationally, one pedestrian was killed every 81 minutes in traffic crashes in 2020. There should be policy safeguards to help ensure that participating in health-promoting activities does not put one’s life at risk. The built environment can safeguard residents or leave them exposed as they travel to work, school, and other necessary travels.
As the COVID-19 pandemic spread, pedestrian and cyclist deaths grew. A few theories suggest explanations for this increase. One researcher posits that people were so saturated with fears of the virus that they ignored other hazards – such as speeding and dangerous driving. Also, with fewer drivers on the road, and the built environment not designed to slow down cars, cars sped up. Another researcher theorized that some people translated their anger and frustration with the virus into aggressive, anonymous driving; people acted in ways that they otherwise would not have. This is not to say that people intentionally killed pedestrians and cyclists, but anger coupled with anonymity and a lack of control in other areas of life lead to people driving faster and more aggressively than ever. For instance, in 2022, a striking 5,778 people were cited going over 100 miles per hour in Utah.
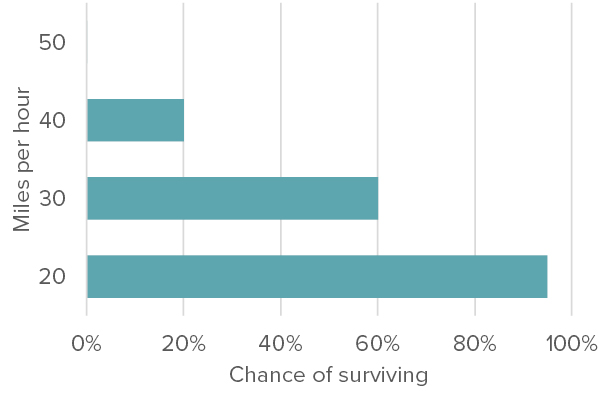
Those speeds are deadly for anyone on the roadway, but the level of speed greatly increases fatality likelihood for pedestrians. If a pedestrian is hit by a car going 20 miles per hour, they have a 95% chance of living compared to only a chance of 20% at 40 mph. (See Figure 7.)
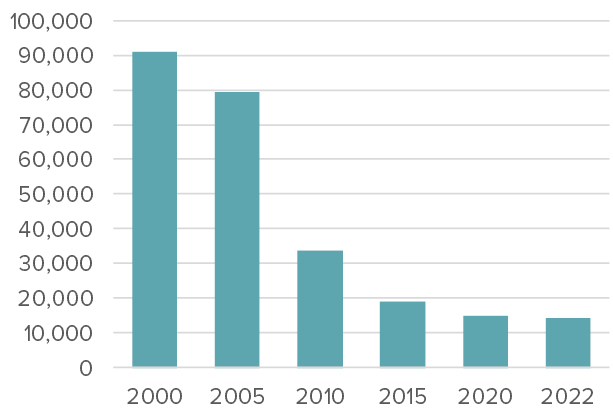
Another factor that could add to an increase in car crashes is a lack of enforcement. According to the Utah Courts Caseload Database, traffic citations decreased by 84% between 2000 and 2022. (See Figure 8.) This could be due in part to 2018 Utah legislation banning ticket quotas for officers. Additionally, since 2019 there has been a steady decline in law enforcement employment in the U.S. and Salt Lake County. In 2021, nearly 200 police departments across the nation were reportedly staffed at 93%; officers are being hired, but more are retiring and resigning. Further, fewer traffic stops have occurred as police are increasingly given more responsibilities and are “spread thin,” therefore often lacking the time for traffic stops.
Getting people outside and moving often requires a high level of convenience, safety, and security. For example, hard bicycling infrastructure (like separated bike lanes as opposed to painted bike lanes) significantly increases the number of cyclists on the road since more people, especially women, are willing to bike when it is safer. This suggests that with more laws and policies increasing safety, coupled with cities building hard infrastructure for active transportation, more people will participate in active transportation and ultimately be healthier.
A need for safety coupled with increased aggressive driving and fewer traffic stops show the need for improved infrastructure, increased enforcement, and new policies and laws that can help keep Utahns safe. Policy solutions for the built environment will be discussed in the second half of this report.
Solutions to Improve Wellness
Communities can make changes to improve their residents’ physical and mental health. In this section, we review strategies that communities have successfully implemented, both in Utah and other states. The strategies discussed in this report include adoption of a Health-in-All-Policies framework, with a focus on parks and open space, park programming, shared-use agreements, and zoning changes.
Health-in-All-Policies Funding and Projects
Incorporating a Health-in-All-Policies framework in cities and towns is key to success. However, many community leaders do not have expertise in health and do not always consider how cross-sector policies can impact health. The Health-in-All-Policies framework can help cities and towns build new bridges with other sectors, create a space for collaboration, and increase understanding of every sector’s impact on health. Get Healthy Utah provided mini-grants during 2022-23 to pilot Health-in-All-Policies projects in three Utah cities: Millcreek, West Valley, and Manti.
Millcreek’s Health-in-All-Policies project focused on conducting a Health Impact Assessment to inform updates to their zoning and subdivision ordinances. The Promise Program and Planning Department worked together to identify priority areas for the assessment, which included access to healthy food, walkability, and livable neighborhoods. The city surveyed residents at the Bud Bailey apartment complex to elevate the voices of Millcreek residents with higher health disparities. Millcreek partnered with Get Healthy Utah, Salt Lake County Health Department, public health students from Brigham Young University, and urban planning students from the University of Utah for this project.
West Valley City’s Health-in-All-Policies project focused on creating a health lens checklist for the city to use when any new policies, proposals, or programs are being considered. A coalition created a Health-in-All-Policies task force to create the health lens checklist, provided public health 101 training for city staff, and drafted a resolution to adopt a Health-in-All-Policies framework within the city. West Valley partnered with Get Healthy Utah, the Healthy West Valley coalition, and the Salt Lake County Health Department.
Manti City adopted a Health-in-All-Policies resolution to implement a Health-in-All-Policies approach to decision-making across all sectors: housing, public safety, education, parks and recreation, air and water quality, criminal justice, and economic development. This framework has the potential to change how community leaders in Manti develop and implement policies. Manti is focusing their efforts on constructing a new walking path, — a great tool to promote physical activity and increase pedestrian safety.
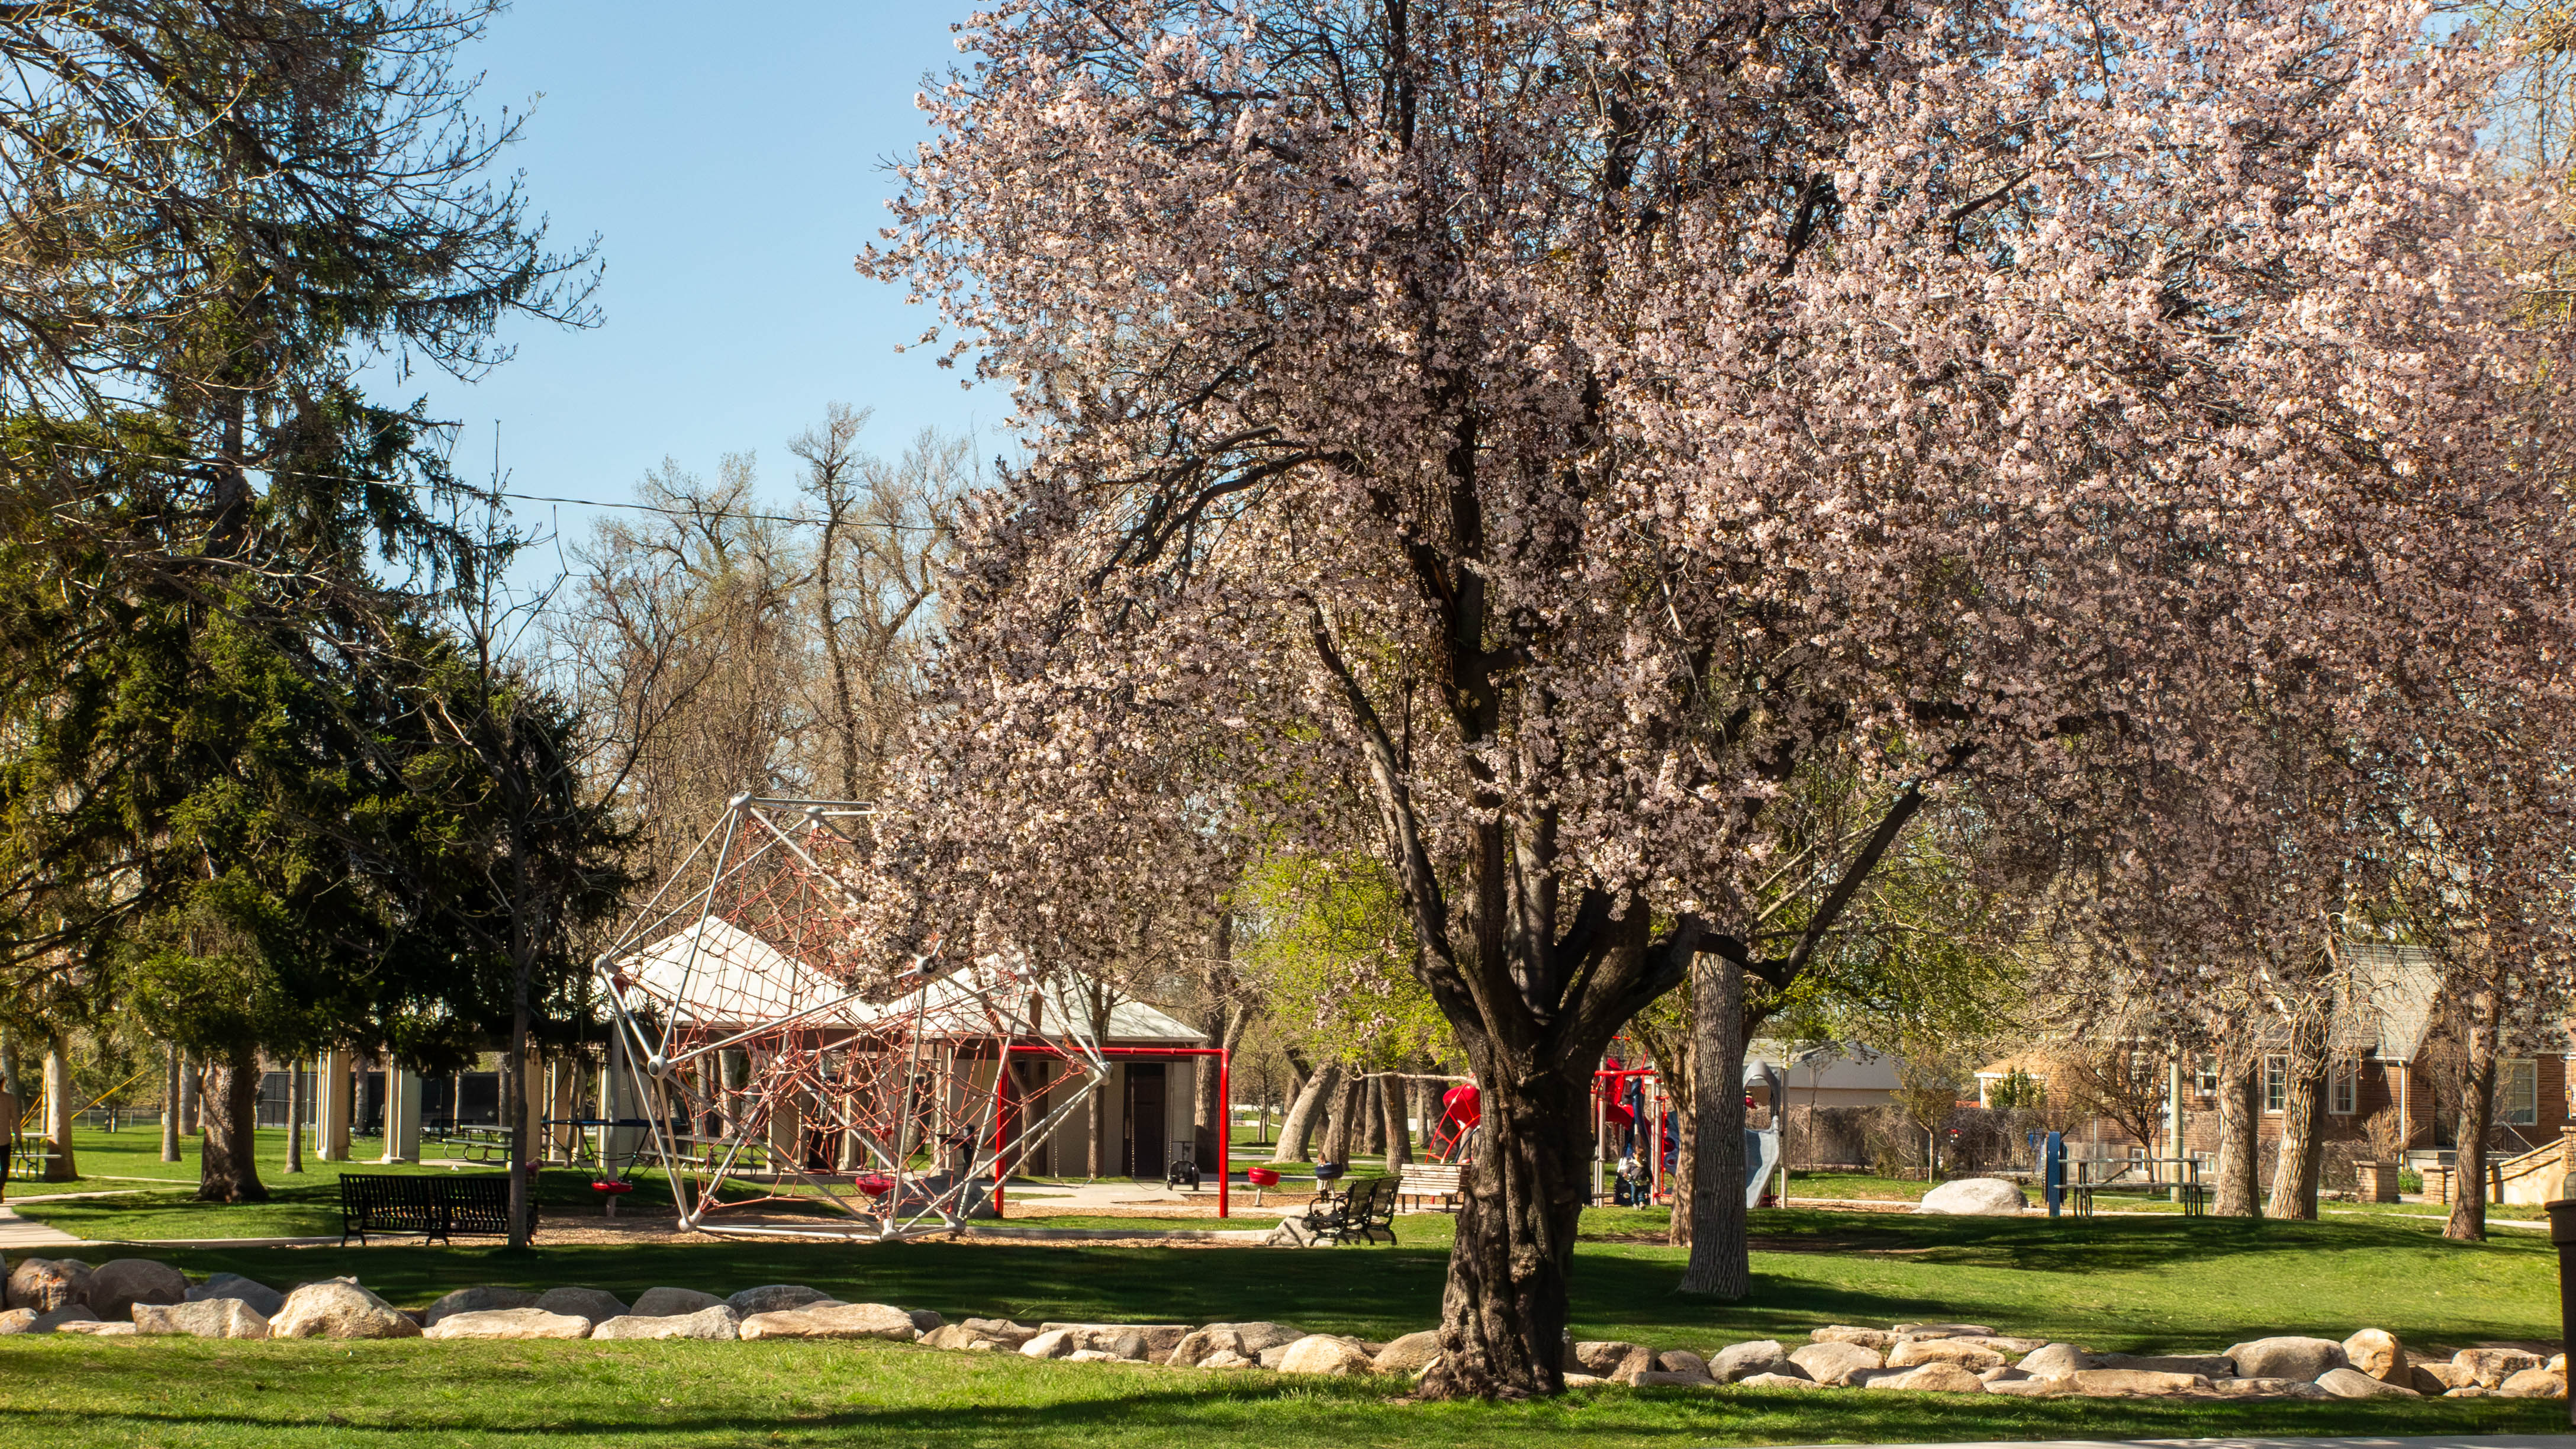
Parks and Open Space
Access to parks and trails provides many health benefits. These include providing space for physical activity, reducing stress, improving mental health, increasing social interactions, and providing connections to nature. Parks can reduce flooding, mudslides, and wildfires by retaining water or by creating a barrier to protect nearby housing or commercial space. They can also reduce heat islands with their tree canopies and greenery. Notably, parks and trails also bring communities together through programming such as community events, sports, and public health programs.
Utahns want more parks and open spaces. The State’s Guiding our Growth initiative is looking to understand what Utahns want. One of the top answers is, “To invest in and plan for more parks, recreation, active transportation, and trails.” The Utah Foundation’s own Quality of Life series finds that parks and recreation is a high priority for Utahns. Utah communities can invest in increasing access to parks, trails, and other open spaces, either by building more or by increasing access to existing options.
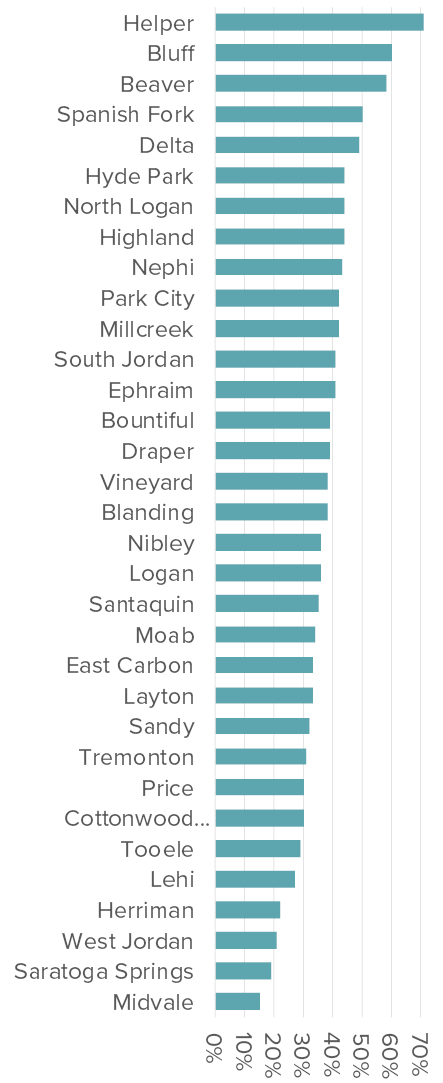
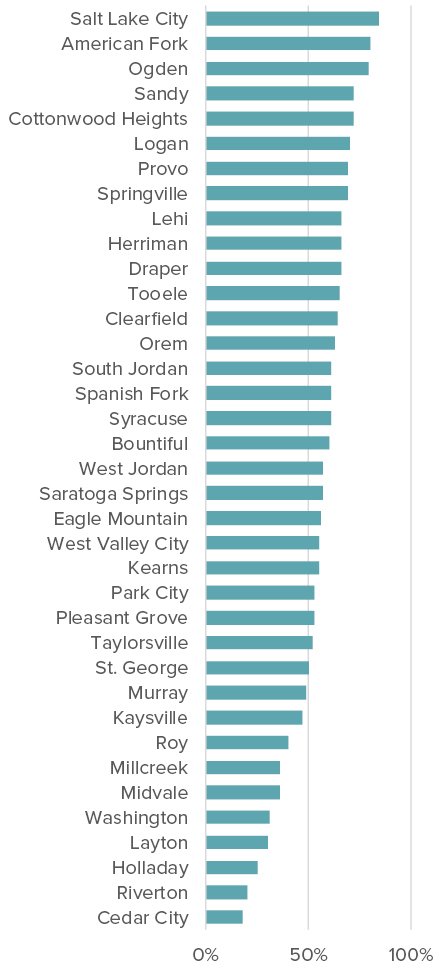
There are several suggestions regarding how close people should live to parks to maximize wellness. The World Health Organization and the National Park Service suggests that urban dwellers should live within a half-mile walk to a park or greenspace. The Trust for Public Land analyzes data by the percent of residents who live within a ten-minute walk of a park, which is the equivalent of about a half mile walk for an able bodied adult. One-in-three U.S. residents do not live within a ten-minute walk of a park or open space in urban and rural communities. The percentage is even worse for the 100 largest cities in America – 45%. Many Utah cities are better than that average, though the differences among cities are stark. For instance, 80% or more of the residents of Salt Lake City and American Fork live near parks, while only 25% or fewer residents of Holladay and Cedar City do. (See Figure 9 for these percentages in Utah cities with over 30,000 residents and Appendix A for smaller cities and towns.)
Cities and towns have several options to increase park access without building more parks. Since cycling is about four-times faster than walking, having good bicycle facilities and infrastructure extends park access distance considerably. Therefore, more people can easily access parks with safe bike infrastructure, as well as providing good public transit and adding multiple entrances to parks so residents do not have to walk as far to reach park amenities. Transit agencies and city planners should consider these options, as part of a Health-in-All-Policies approach, in their planning and development criteria.
In cities and towns where building more parks and green space seems infeasible, a solution could be maximizing yard-sizes for low-income families. Researchers have shown that yard-size around a child’s home is positively associated with their physical activity later in life. Private and semi-private yards around apartments and condos reap the same benefits as private and semi-private yards around single-family homes.
(See the Utah Foundation’s Advancing Open Spaces report from this series for a more in-depth discussion of parks and greenspace.)
Increasing Park Usage
Utah communities can increase community members’ time at parks through park design and programming. As discussed above, getting people outside and interacting with their community increases health and wellness. In a 2017 Envision Utah survey, respondents were asked to think about the things that their local community or public policy maker could do to influence their health in a positive way. A top answer was to “increase the availability of affordable or free recreational opportunities for physical activity.” In fact, about 38% of respondents said that this would have a good amount of impact and another 49% said this was one of the most impactful/influential things (87% total). While the addition or revitalization of park land is only one step toward local governments creating healthier and safer communities, encouraging park utilization is perhaps just as important.
Programming, or scheduled activities, can help parks be successful. Researchers at Utah State University, the University of Utah, and the University of Connecticut conducted a small study by observing 30 neighborhood parks at various times of day, on weekdays, and over weekends in Salt Lake County in the fall of 2017. The researchers found that parks were empty 26% of the time. Parks were more populated in the afternoons, in neighborhoods with high-incomes, and in neighborhoods with higher population density and with mixed land uses. Parks with playgrounds and good maintenance were also used more. Parks that attract more users have tailored facilities such as well-maintained playgrounds and trails with shade, and the busier parks had organized activities such as sports and community events. There were more men at the parks than women and more adults than children; women were more likely to visit parks in the afternoon than in morning hours. Children were more likely to visit parks in the afternoons with organized activities and good maintenance; seniors were more likely to visit parks with organized
activities, good maintenance, and in more walkable neighborhoods. This research shows that putting extra maintenance and amenities into parks seems to increase use which in turn would benefit the health and wellness of the communities.
Park amenities that supported organized activities saw some of the highest use. Soccer and football fields, playgrounds, and lawns had the largest number of users. Picnic areas, playgrounds, and skateboarding areas had the highest density of users. Baseball fields and water features were not popular during the study in either number or density of users; however, this could be due to the researchers analyzing the park in the fall instead of spring or summer. This research highlights the role of programming in encouraging people to parks. Getting people outside and interacting with their community increases health and wellness, as previously discussed.
According to researchers, successful parks are memorable and unique, accommodate many uses, and are highly accessible. Parks can be visually memorable and distinct by using natural features of the area and not just turf; in other words, parks should be “Instagram worthy.” Parks can offer, for example, work-out equipment and gardens to accommodate a variety of uses. Finally, parks should be accessible on foot and by bike with multiple park entrances, perhaps linked to people and a variety of areas by trails – and not simply surrounded by single-family homes.
Naturally, big parks and facilities do not guarantee usage, but programming that is directed toward user groups is shown to attract park goers. Successful park programming is tailored to what the surrounding community actually wants and needs. Community leaders should listen to their community to find out what activities would bring people together and then implement those activities.
Schoolyards (and Other Spaces) as Parks
Shared-use or community-use agreements allow for access to existing facilities, defining the terms for sharing the risk and cost associated with sharing the property and amenities. This allows for underutilized properties, such as school yards, community centers, churches, colleges, libraries, or other similar public or private entities to grant use of their property before or after hours of operation. Shared-use agreements can be formal or informal based on a community’s needs.
In Utah, schools are considered civic centers; as long as the activity organizer using school facilities lives within the school’s geographic boundary and do not interfere with school activities, they can use the facilities. However, this code is vague and school districts have their own say on whether individuals are able to use the school yards or if access is limited to organizations with a shared-use agreement. Shared-use agreements often take the form of rental agreements. An example of a shared use agreement would be a girl scout troop using a school gymnasium or a little league using the green space outside of a community center.
Finding additional uses to underutilized land does not work as well if the schoolyard, church yard, or community center has only a paved black top or too large a proportion of black top. Swapping trees, gardens, green spaces, and updated playground equipment could increase the desire to use this area for a variety of uses.
The greening of schoolyards has other benefits as well. It has been shown to improve students’ attendance, behavior, and test scores. Additionally, replacing black top with trees and greenspace enables better absorption of stormwater to mitigate flooding and cools the area during hot weather. A study by the Trust of Public Land found that 36% of public-school students nationwide attended school on a “heat island,” which is 1.25 degrees Fahrenheit warmer than the surrounding city or town. Among those students, 4.1 million students attended school in a severe heat island of seven degrees hotter than the surrounding area and 1.1 million attended school in an extreme heat island of 10 degrees hotter than the surrounding city or town. Adding trees and green space would help cool down these heat islands; using indigenous plants would mitigate excess water usage and encourage native flora and fauna growth.
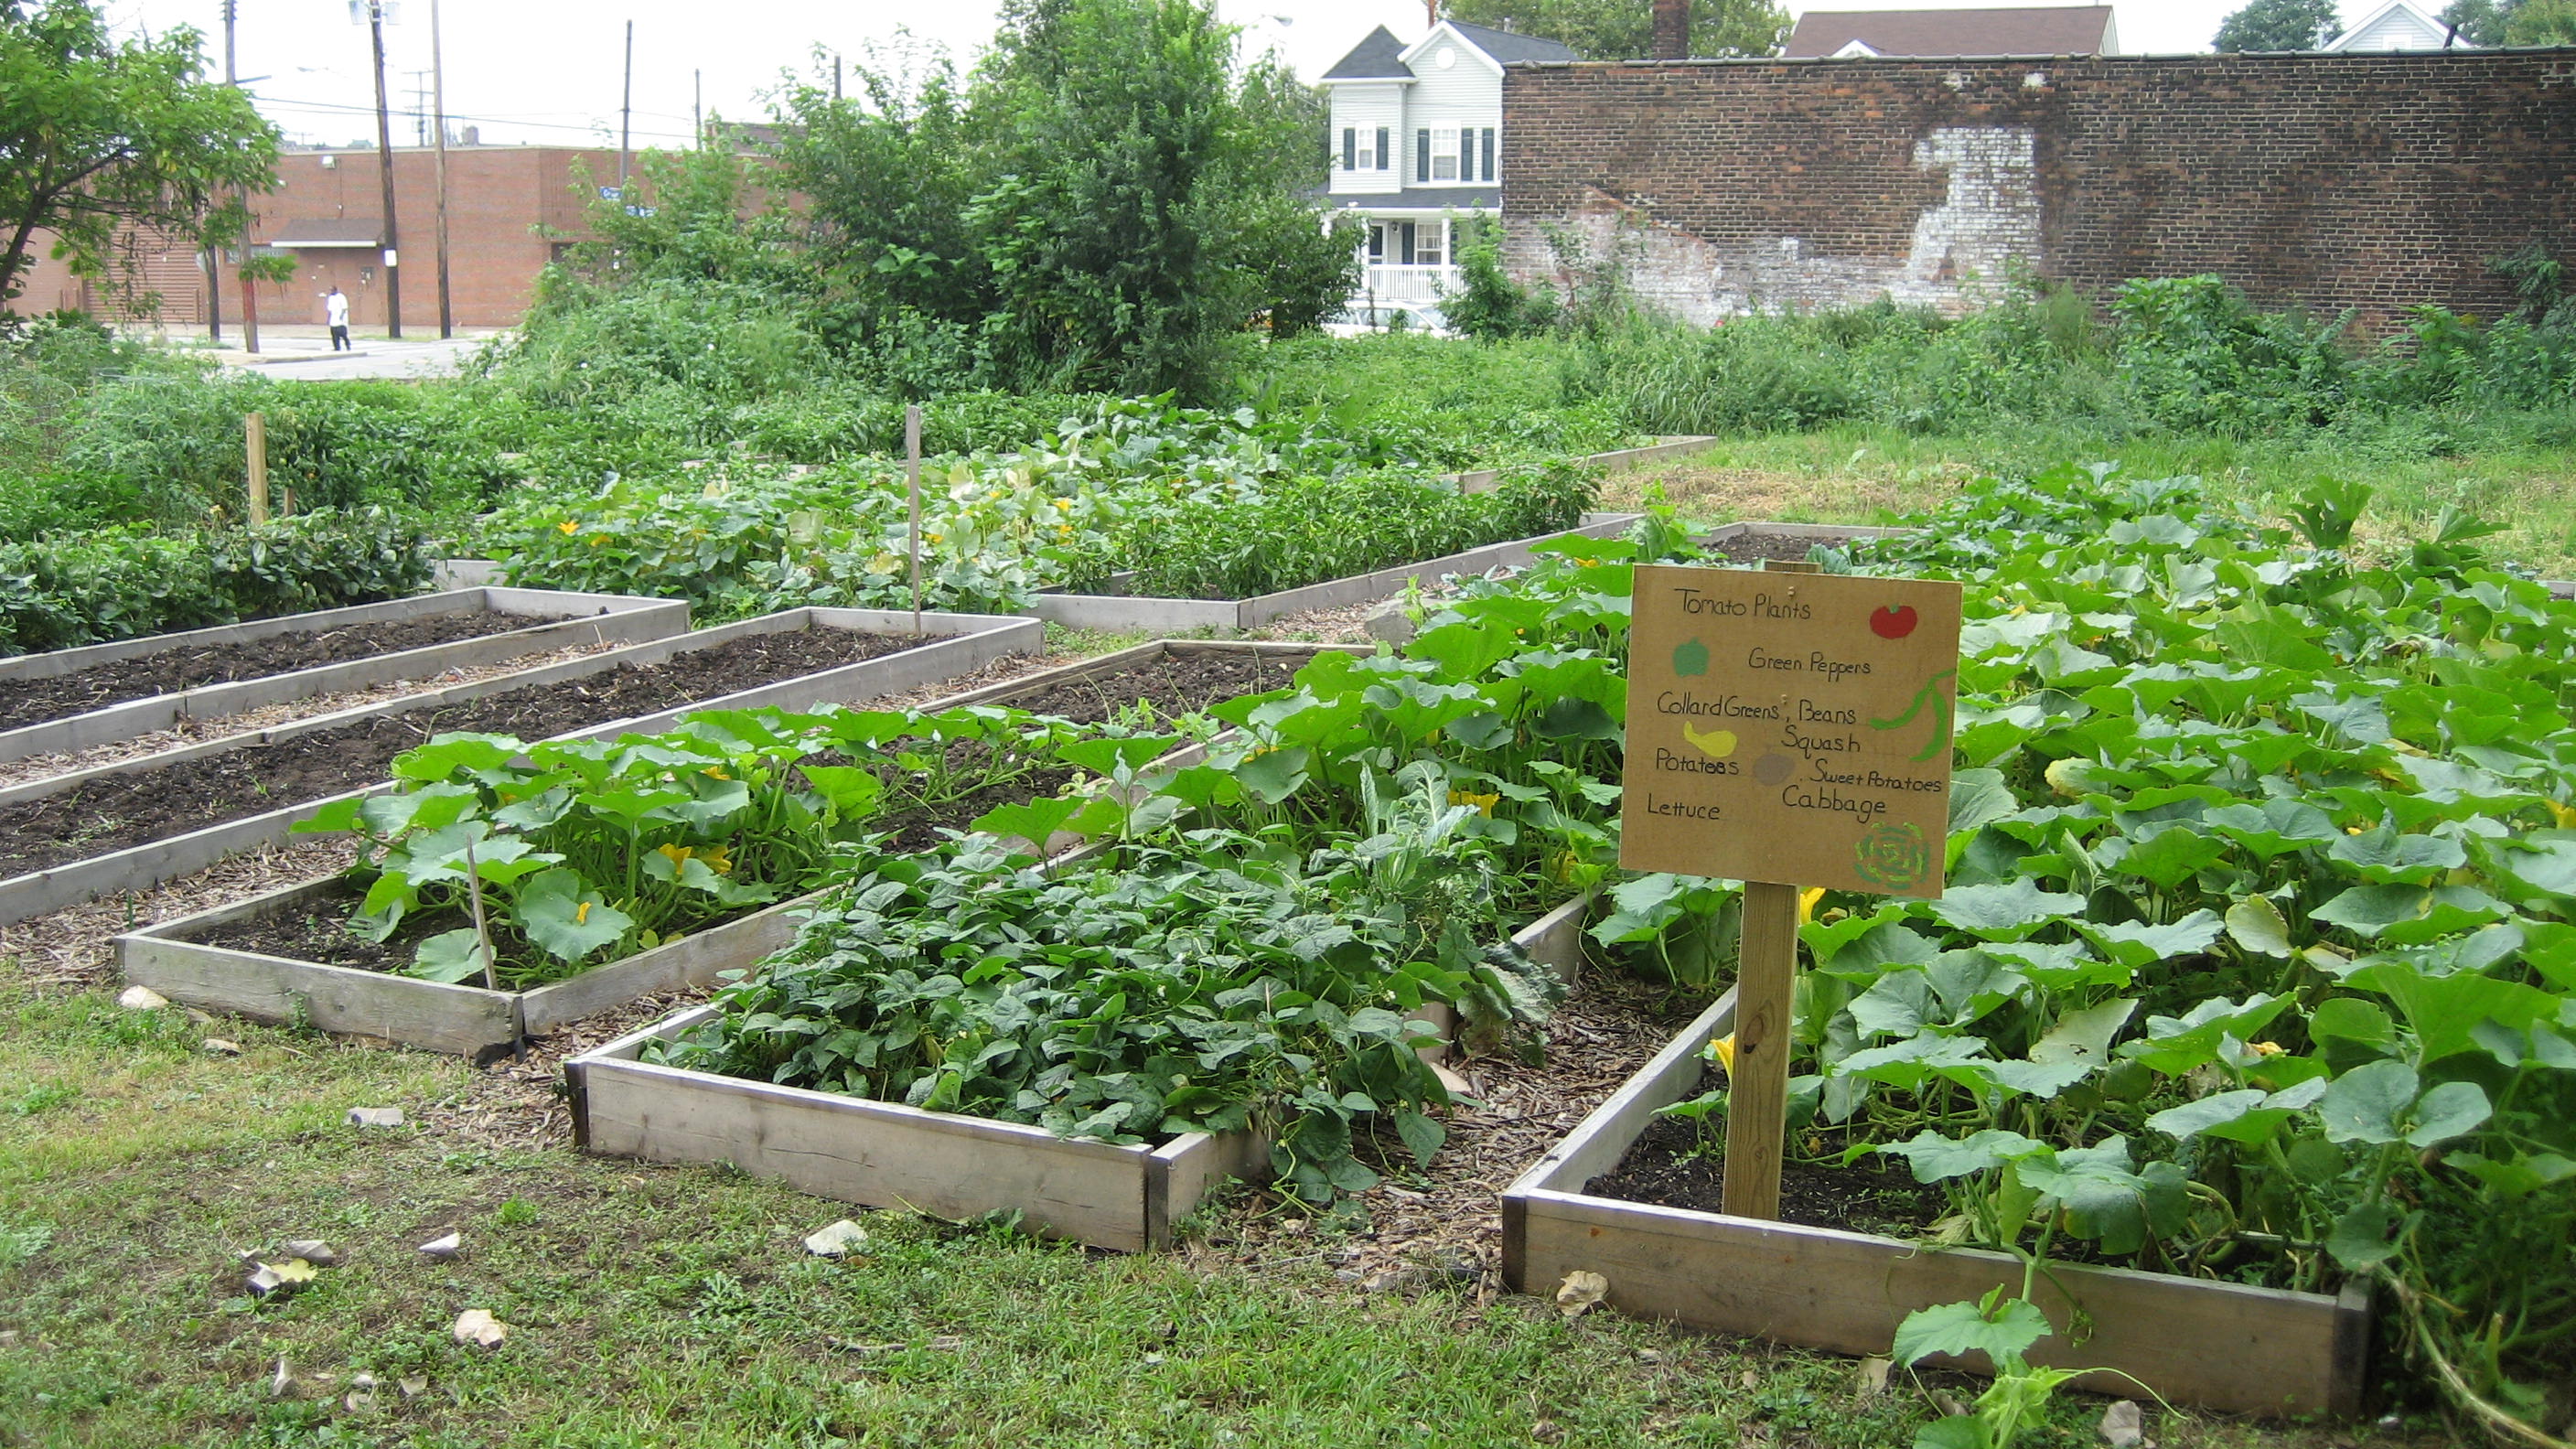
An additional use of schoolyards – as well as church lands and other underused space – is community gardens. Shared-use agreements can be created for community members to be able to use these spaces to garden. Increasing urban agriculture could mitigate issues like food deserts and heat islands at the same time.
Churches and other private organizations that are only used a few times a week present an incredible opportunity to serve the local community around them. Although city officials have little control over what schools, churches, and other places with green spaces do with their land, community officials can work to create an environment of collaboration and community gathering that encourages the better use of all land for the wellness of the community.
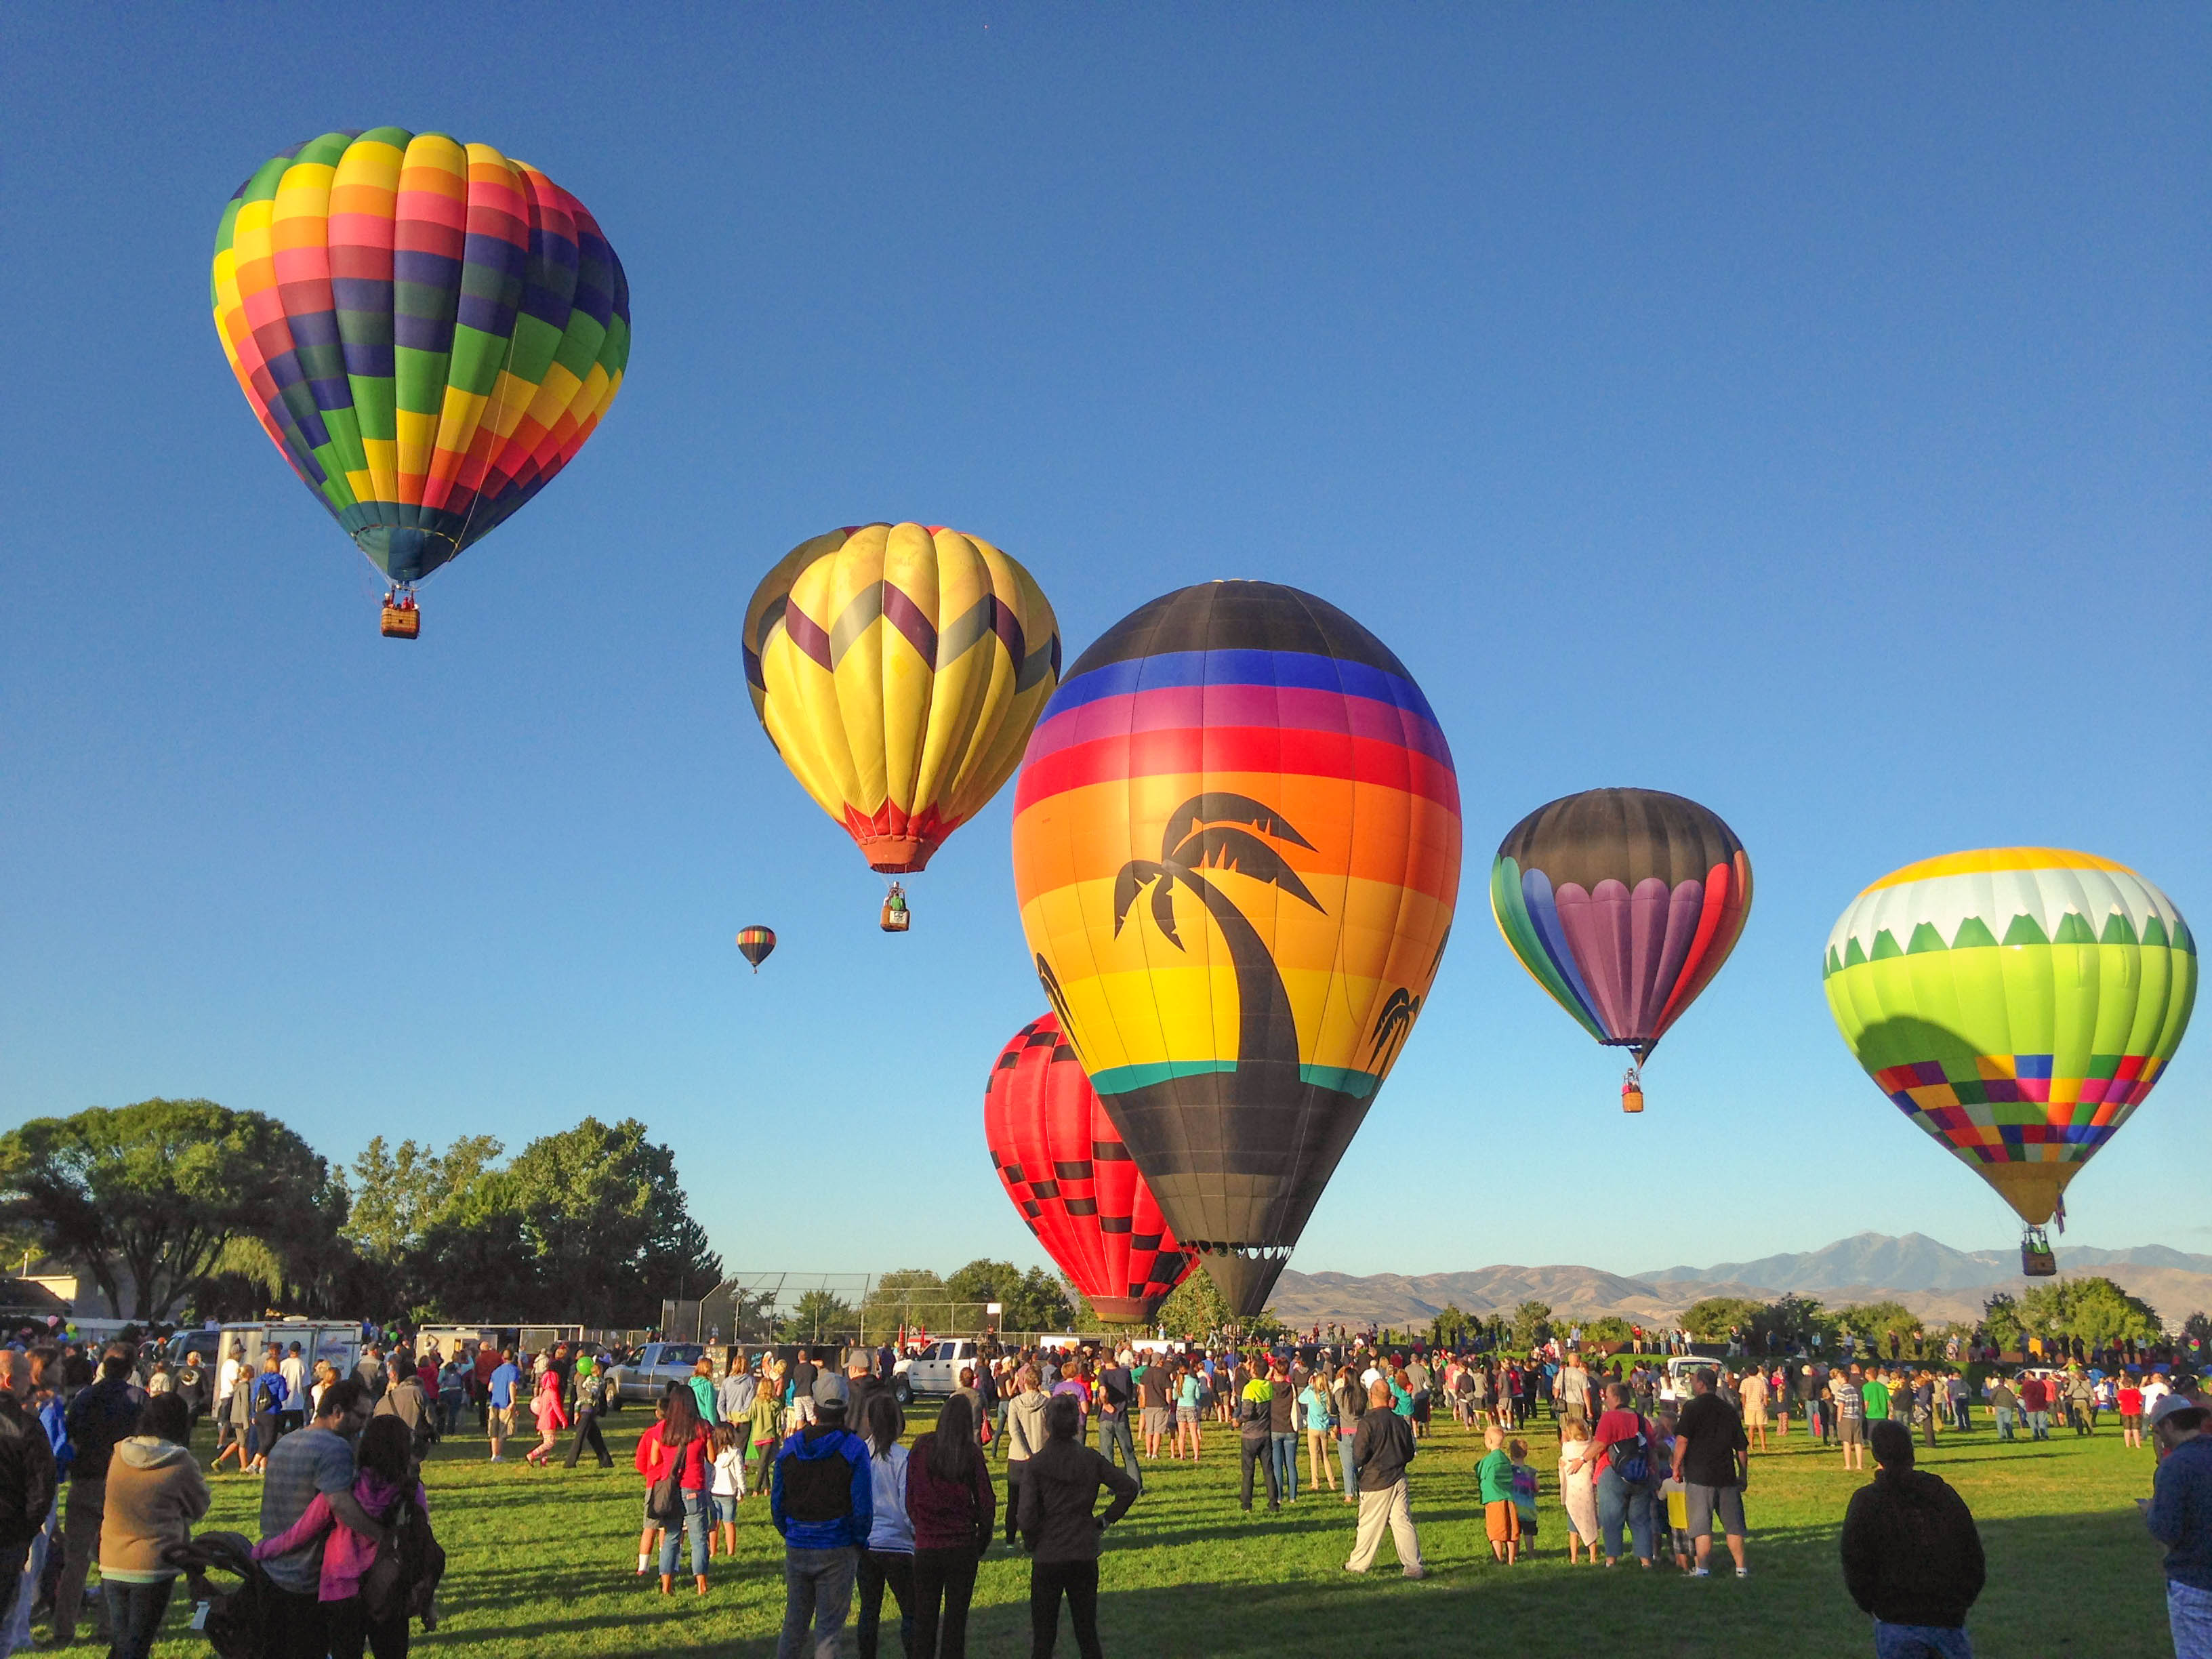
Community Programing in Sandy City
The Utah Foundation found, in discussions with city officials, Sandy City exemplifies a municipality working hard to encourage community connection and engagement in city events. The city focuses upon enhancing city events and encouraging more civic engagement. Sandy Events Manager Katie Atkinson feels strongly about gathering her community using creative programming to get people into parks stating:
“I think we all felt during the pandemic what an integral role our community events add to quality of life. I look forward to finding new ways to highlight our parks, resources, businesses, and citizens in a way to create opportunities in gathering our community.”
Community leaders with this kind of mindset can help make the most out of parks and community spaces. Sandy provides a variety of events and publishes all city events on its website to help residents to find the events. Some of the events Sandy City is hosting this year include:
- Weekly Food Truck Nights at the Sandy Amphitheater Park on Mondays – often coinciding with other events.
- Free yoga in the Amphitheater Park every Thursday evening in June through September.
- Movie nights in the park with food trucks during the summer.
- July 4th Celebration & the Balloon Night Glow at the Sandy Promenade just south of City Hall.
- Two morning hot air balloon launches at Storm Mountain Park.
- The Heritage Festival and Horse Parade takes place in Historic Sandy in September.
- Multiple 5K races and Family Skate Nights throughout the year.
Each city and town should assess which events and activities will most effectively bring their residents together and make use of available open space while simultaneously yielding positive health outcomes.
Zoning
County Health Rankings shows that zoning regulation and land use policy reforms are evidence-based ways to support community health and wellness. This includes increasing homeownership, increasing pedestrian mobility and safety, increasing food security, and accommodating diverse employment opportunities. All of these improvements work together to benefit Utahn’s health.
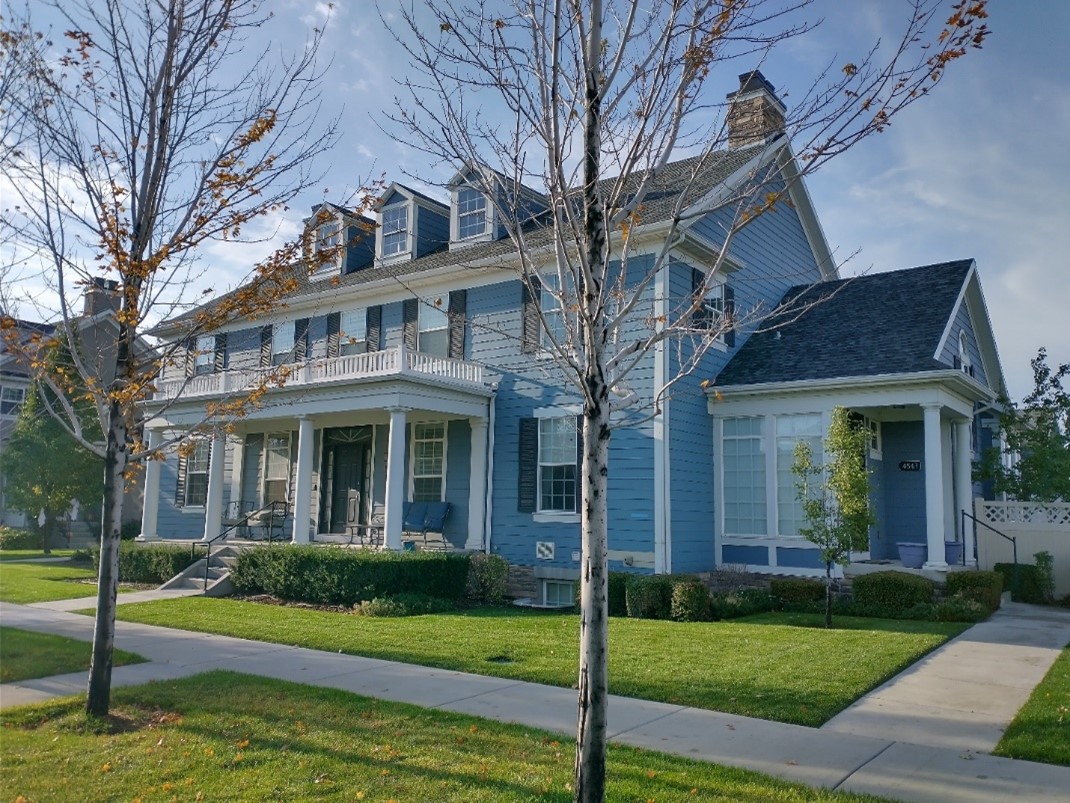
Zoning regulations that maximize Utahns’ affordable housing options are key as the state’s population continues to grow and more than half of Utahns are unable to afford a median-priced home. These reforms can look at promoting compact development with mixed-use, higher-density areas and building taller buildings. Additionally, compact development is shown to increase physical activity, use of active transportation, pedestrian feelings of safety, sense of community, social capital, and health benefits. It is shown to decrease social isolation, transportation costs, and household energy use. Zoning reforms with a Health-in-All-Policies approach could help incentivize higher-density, multi-family housing.
The Utah Foundation has written extensively on housing affordability. In the recent Middle Housing Study’s survey, most respondents (60%) support more affordable housing options in their neighborhoods, with 38% strongly supporting more options. They are particularly amenable when the housing is in similar scale or appearance to single-family homes as opposed to large and often visually dominating apartment buildings. Affordable housing leaves more resources for health care and healthy food, which results in better health outcomes and better mental health outcomes.
Local policymakers might consider reducing their parking requirements for new developments. Parking requirements can be an impediment to affordability by increasing construction costs, which results in increasing rents. Beyond affordability, large parking lots create barriers for walkability. It is important for local policymakers to take a hard look at their parking needs to discover whether the requirements suit actual needs and whether the payoffs in terms of driver convenience are worth the tradeoffs in housing affordability.
Permitting multi-unit buildings in all districts and permitting varying unit sizes within mixed-use buildings are additional ways to create affordable housing. As family sizes grow and shrink and as budgets change, families would be able to stay in their communities as they go through different seasons of their lives, such as having children, getting new jobs, seeing kids moving out, or losing their jobs. Varied unit sizes are more likely to allow people to stay in their communities regardless of income and family size. Additionally, with mixed-use zoning, walkability is increased due to the higher density of buildings and locations to which individuals can travel.
County Health Rankings recommends that cities partner with developers to make developments more sustainable and to make communities built around people and places rather than cars. Zoning reforms can include codes which specify criteria for sustainable design. This looks like creating proximity to everyday destinations, like grocery stores and schools, via active transportation networks. This benefits individuals who are unable to drive or afford their own car, which limits their access to amenities and economic opportunities. Further, compact development can reduce vehicle miles traveled and therefore the air pollution and greenhouse gas emissions.
These everyday destinations can be in mixed areas. Permitting mixed zoning allows for diverse economic activities by allowing people to make money from their homes. Specifically permitting live-work units and small-scale daycares could benefit residents. Allowing urban agriculture, fruit trees, and farm stands for food grown-on-site benefits communities economically and provides sources of fresh food in food deserts. (See the third release of Utah Foundation’s Healthy Communities series for a more robust discussion on food security.)
Zoning should focus on health and community needs while attempting to respond to future needs. For example, in communities with a lack of walking and active transportation, housing policies that can increase street activities should be a focus. In communities in food deserts, increasing access and food growth should be a focus. In communities with traffic fatalities, preventative infrastructure and policies should be a focus. These problems are all interconnected. The goal is to find out how communities would define successful solutions and work toward implementing those solutions.
As communities develop and change, the concern of gentrification and residents getting priced out of their own neighborhoods rises. Communities should seek to address inequities that can accompany zoning and other major land use changes. However, a more detailed discussion of gentrification is outside the scope of this report.
Car Culture
The healthy choice should not be the hard choice. Transportations options should be available so that residents are not required to have a car-centered lifestyle. Utah urban planning has long been car-centered, forcing Utahns to use only one main mode of transportation. With public transportation and active transportation options, Utahns are able to make their own decisions and have the freedom to choose how they get around.
According to U.S. Census data from 2021, 66% of Utahns drove to work alone and 9% carpooled, while only 1% used public transportation, 2% walked, and under 1% biked. About 20% of the workforce worked from home and therefore did not have a commute. (See Figure 10.) Having 75% of a workforce commuting by car highlights that Utah is car-centric – not fully supporting other modes of transportation. Supporting Utah’s existing transit network along the Wasatch Front and establishing connections between active transportation and transit presents a remarkable opportunity to develop multimodal systems and discourage car dependency.
In car dependent communities, households spend approximately 50% more on travel related costs than households in communities with better bicycle and pedestrian facilities – or an average of $3,000 extra per year. Along the Wasatch Front, about 20% of work commutes are within three miles of home. This would be a reasonable bike ride for most Utahns and an incredible way to increase the amount of physical activity these Utahns get in a day, saving on fuel costs at the same time.
Active transportation and public transportation are not just alternatives to driving – they are many people’s only option. Utahns over 75 years old comprise over 4% of the population, Utahns under 16 years old are 23% of the population, and Utahns under the age of 65 with a disability are 7%. Many of these populations are not counted in the workforce shown in Figure 10, but they should not to be forgotten during transportation planning. Transportation networks need to accommodate the needs of all users and not just augment the transportation options for the young, able-bodied Utahns with access to cars.
|
“If you plan cities for cars and traffic, you get cars and traffic. If you plan for people and places, you get people and places.”
-Fred Kent, Project for Public Spaces
|
Solutions to Improve the Built Environment
There are numerous potential solutions to the road safety and health issues discussed above. The solutions discussed in this report include the following: bicycles and trails; enforcement, laws, and goals; Complete Streets; and other road calming measures.
Bicycles and Trails
A 2017 Envision Utah survey asked respondents to think about the things that their local community could do to influence their health in a positive way. A top answer was to “promote safe walking and biking in neighborhoods and communities.” About 45% of respondents said that this would have a good amount of impact, and another 40% said this was one of the most impactful/influential things (85% total).
Many policy solutions are in the works to address road safety issues. The League of American Bicyclists ranked Utah as the 10th most bicycle friendly state in 2022. This is specifically due to passing laws like the Three Foot Law, crafting a statewide bike plan, spending 2% or more of federal funding on biking and walking, and having an emphasis on bike safety. In 2017, Governor Gary Herbert announced an initiative to create 1,000 miles of family-friendly bike paths, trails, and lanes by 2027. As of 2022, 644 miles have been completed.
In 2023, Governor Spencer Cox announced plans to create an intrastate trail system that would “connect Utahns of all ages and abilities to their destinations and communities throughout the state.” The Governor’s “vision will be a sustainable contribution to the quality of life for Utahns and visitors for generations to come.” The Utah Legislature then passed a bill for ongoing trails funding as a percentage of overall transportation funding – starting at $45 million in 2024 – as well as $45 million in one-time support to connect and maintain paved trails around the state.
With these funds, the Utah Department of Transportation plans to improve Utah’s trail system to increase the number of car-free trails that commuters can use for traveling across cities and even counties – much like the U.S. interstate highway system. This could increase the number of people participating in active transportation and outdoor physical recreation, such as walking, biking, and running for daily commutes, fun, and exercise. Traveling on car-free trails is safer and less stressful than riding alongside automobiles.
|
“At some point in the future, we’ll be able to get from anywhere in Utah to anywhere else without having to get onto a roadway to accomplish that and to do so safely in a way that brings people together.”
-Governor Cox
|
Educating youth on how to be safe travelers when using active transportation is very important. One way to do this is by using Traffic Gardens which are small-scale models of streets that are painted onto a paved surface that can allow kids to practice following traffic patterns in a safe, gamified environment. Bike rodeos can be held to teach the importance of bike safety and the skills kids need to bike safely. Utah Emergency Medical Services for Children and the Highway Safety Office have two bike rodeo trailers that contain all of the equipment for conducting a bike rodeo at no cost to the users. Bike Utah has a Bicycle Education and Safety Training program where they educate over 3,000 Utah kids a year on how to safely and confidently travel in their community via bicycle. These programs not only encourage kids to participate in active transportation, but also create drivers who are more aware of vulnerable users of the road.
Enforcement, Laws, and Goals
Passing and enforcing laws to increase the safety of active transportation can encourage more residents to embrace active transportation as a viable option. One example of a successful active transportation law is the above-mentioned Three Foot Law. This law stipulates that cars cannot be closer than three feet to a cyclist, pedestrian, skateboarder, moped, wheelchair, and other similarly vulnerable modes of transportation. The Three Foot Law passed with ease and became law in Utah in 2013. While the penalty for breaking the Three Foot Law is a class C misdemeanor, laws like this are only effective if they are enforced. Due in part to a decrease in traffic policing, traffic laws like the Three Foot Law are being enforced at a low rate. If laws are not enforced, then this law is ultimately useful only as an educational campaign.
Similarly, ticketing more speeding drivers would slow down traffic. Roughly a quarter of the U.S. population is stopped every year for traffic stops. However, these stops are sometimes seen as dangerous from the points of view of police and residents alike. A 2022 study found that respondents viewed photo radar – or using cameras for traffic enforcement – as a better way to ensure that traffic laws are upheld, while reducing the potential for racial profiling and minimizing potentially violent encounters between the police and the public. In Utah, photo radar can be used in reduced speed school zones, in an area with a speed limit of 20 mph or less, or on a highway if a sign is posted stating that photo radar might be used. Using photo radar more could slow down drivers and reduce car crashes.
As was discussed during the 2022 Utah Legislature’s interim session, state code could expand the applicability of photo radar and local municipalities could consider increasing the use of photo radar under existing law. As long as cameras are not disproportionately located in low-income neighborhoods or communities of color, then using photo radar could be an equitable way to enforce traffic laws and increase public safety without burdening law enforcement.
Communities could automate enforcement of other laws to promote active transportation. In 2022, the New York State Senate passed a bill to establish cameras that automatically ticket cars that block bike lanes, in the hopes of creating safer streets for cyclists. New York City already has cameras on buses that ticket cars for blocking the bus lane. Applied in Utah, these measures could reduce interactions with police officers, reduce officer work load, and increase safety on streets for those using active transportation. Adding cameras to Utah intersections could help decrease the number of automobiles running red lights and speeding, as well as potentially ticketing for Three Foot Law violations and other traffic violations – all fortifying pedestrian and bicycle safety. Again, without enforcement, these types of laws are useless except as educational tools.
Utah legislators recently passed speeding amendments that increased fines for driving over 100 miles per hour and made driving over 105 miles per hour a class B misdemeanor. Another law aimed at increasing road safety makes it illegal to use a phone while driving, with the exception of a hands-free device. A bill introduced in the 2022 legislative session would have established even stricter consequences for distracted driving. However, similar to the Three Foot Law, without enforcement, speeding and distracted driving will continue to be a safety issue. Speeding was a factor in 29% of U.S. traffic fatalities in 2020, attributing to 10,136 deaths nationwide. Distracted driving was a factor in 8% of traffic fatalities that same year.
In response to an increase in traffic fatalities, Salt Lake City Mayor Erin Mendenhall committed the city to Vision Zero. Much like the Utah Department of Transportation’s Zero Fatalities goal, Vision Zero is an approach that believes that “everyone has the right to move safely in their communities, and that system designers and policy makers share the responsibility to ensure safe systems for travel.” Sometimes mistakes happen on a road, but roadways should be designed so that the mistakes reduce the likelihood of severe injuries and fatalities. The Vision Zero approach does not accept that any fatalities should happen. In Salt Lake City’s adoption of the Vision Zero approach, the city leaders and planners will be expected to prioritize health and safety in designing the built environment.
Complete Streets
Designing community roadways with the Complete Streets approach increases safe usage of roads for pedestrians, bicyclists, equestrians, other vulnerable road users, and drivers. An ancillary goal is to emphasize investment in neighborhoods and communities that have historically experienced underinvestment. This approach looks at each individual street with a lens toward redesigning them in a way that includes sidewalks, special bus lanes, bike infrastructure, accessible public transportation stops, frequent and safe crosswalks, median islands, accessible pedestrian signals, curb extensions, roundabouts, narrower travel lanes, and similar hard infrastructure that slow down car traffic and give more space for active transportation and public transit.
County Health Rankings concludes that Complete Streets policies “have been tested in many robust studies with consistently positive results.” Potential benefits of Complete Streets are increased active transportation, reduced obesity rates, an improved sense of community, improved neighborhood safety, reduced stress, and reduced car miles driven. Strategies for Complete Streets range from short-term wins with no-cost to low-cost strategies, to long-term investments which can be expensive.
Each city and town in Utah should consider developing Complete Streets plans to increase roadway safety. The needs of users depend on context, and Complete Streets plans will look different depending on the setting, from rural to suburban to urban. Salt Lake City, Salt Lake County, Park City, St. George, the Utah Department of Transportation, and Wasatch Front Regional Council have all adopted Complete Streets policies.
In Salt Lake City, Mayor Ralph Becker signed an ordinance in 2010 that required the accommodation of pedestrians and cyclists, unless the cost is disproportionate to the need, whenever a street is built or repaved. A Complete Streets Committee was made to oversee this process.
In Southern Utah, St. George incorporated Complete Streets policies in 2021. They explain their Complete Streets focus with the following:
Walking and bicycling are not niche activities or sports, but rather should be integral pieces of transportation and recreation systems and strategies, allowing St. George residents and visitors to enjoy increased mobility and independence, increased property values, improved health, a safer walking and bicycling environment, and, in general, better quality of life. A city designed to safely and naturally allow everyone to experience these benefits, from an eight-year-old walking to school to an eighty-year-old wanting to visit friends or family, or buy groceries, is a successful city.
Smart Growth America and the Center for Disease Control and increased an interactive, web-based Benefits of Complete Streets Tool to measure health, safety, environment, and economy improvements – with a focus on equity. The tool enables users to input data about a proposed or existing Complete Streets project. Once the user enters data, the tool produces quantified benefits of the project, such as cycling’s positive air quality impacts or the impact of automobile speed reduction on rates of diabetes and depression. These data help community leaders showcase the benefits of project-level interventions to their communities in an understandable and tangible way.
Complete Streets in Rural Communities
Every road, city, and town is different, but every community has a need to keep their residents safe. Rural towns face unique challenges in creating safe roads for their communities, but the Complete Streets and the Health-in-All-Policies approaches remain the same.
A common challenge that rural towns face is that many have main streets that double as highways through town. Many of these main streets prioritize through-traffic over local traffic and some through-traffic vehicles do not sufficiently slowdown from highway speeds. This creates a dangerous environment for pedestrians, cyclists, horseback riders, and other vulnerable roadway users.
|
Quality of Life and the Built Environment
Many respondents to the Utah Foundation’s 2022 Quality of Life survey were concerned about the built environment. One Utahn summed up many respondents comments by noting the need for “more pedestrian friendly, safer, walkable streets, with actual sidewalks, more crosswalks with safety lights and signs, more bike lanes, more posted speed limits and speed bumps to slow traffic through neighborhoods.” Parking, road conditions, and infrastructure were major concerns of 10% of respondents. Another 10% were concerned about the attractiveness of the built environment and 7% were concerned with improving and building more parks and community spaces. Other respondents’ top concerns were traffic (9%) and transit (6%).
The 2022 Quality of Life series pointed toward four key areas of focus for improving quality of life. These are:
- A need for promoting the production of quality, affordable housing and for finding other ways to reduce the cost of living.
- Investing in the built environment and enhancing land use policies to promote attractive, high-quality developments and streetscapes that are pedestrian friendly and include key amenities.
- Building on policies and programs aimed at improving air quality.
- Investing in transportation and transit infrastructure to reduce traffic and improve the quality of roads and highways.
Each of these could use a Health-in-All-Policies approach by Utah’s municipalities looking to increase their residents’ quality of life.
|
The rural town of Bluff, Utah takes an innovative approach to increasing safety on its dual-purpose main street and highway. Bluff mitigates the dangerous high speeds of their center street, which is Highway 191, by creating walking areas behind the commercial buildings. This directs walking traffic to a shielded area and could increase patronage to the store fronts along the downtown area.
Bluff created an Active Transportation Advisory Committee in August 2022 to explore opportunities like creating Active Transportation Plans, safe streets, planning grants, and reconnecting communities. The town is working with Bike Utah to host community workshops to hear community voices and garner broad stakeholder feedback. This is a great example of a community that is creating active transportation routes to destination-based facilities, like grocery stores or schools, so that residents can bike or walk to the places they regularly visit.
Bike Utah is encouraging towns to think about multimodal supportive, rather than car-centric land uses. Multimodal supportive land uses are those that create a safe, comfortable, convenient, and interesting environment for active transportation. Communities should be creative and thoughtful as they explore new ideas to make their towns more friendly for active transportation.
The physical constraints of rural terrain pose another challenge for rural communities as they look to implement facilities for walking and biking. Rural communities must often balance farmlands, desert, mountains, canyons, and other obstacles while creating trails and road calming measures. Balancing these constraints is critical, as active transportation infrastructure can aid rural areas’ higher rates of physical inactivity and associated chronic diseases when compared to urban areas. Even though rural towns have smaller populations, there is just as great a need to consider Complete Streets approaches for road calming, active transportation opportunities, and community connectedness.
Active Transportation Plans
To tie all these strategies together, cities and towns should create their own Active Transportation Plans, also known as bicycle & pedestrian master plans. These plans guide local governments as they develop active transportation infrastructure and ensure better transportation options for all users of the road. Having Active Transportation Plans can help communities better qualify for grants, as it shows funders that the cities have engaged with their communities to develop plans that aligns with the communities’ values, goals, and aspirations. The plans dictate new codes which then dictate new development. Chris Wiltsie, 1,000 Miles Program Director at Bike Utah, engages with cities and towns all throughout Utah about developing their own Active Transportation Plans. Wiltsie emphasizes that communities want a built environment that emphasizes “high comfort and high safety.”
Like active transportation plans, communities could implement Walkability Action Institute training. These trainings show community leaders how to analyze their own community to make them more walkable and rollable. For example, Nibley City officials participated in a training that resulted in an Active Community Tool to assess their local built environment, planning, and policy supports for active transportation. This action plan helps community leaders know what their specific community needs are and encourages them to not just check the box for being ADA compliant but make their streets truly accessible.
Road Calming
Either as part of a Complete Streets approach or as standalone solutions for street safety, road calming measures can be an important tool. Some solutions require low cost and low effort, while others might require more public resources and political capital.
No- and Low-Cost Strategies. One low-cost strategy is to program crosswalks to give pedestrians an additional three to seven seconds to start walking across the crosswalk before cars start to move. This can help establish pedestrians’ presence in crosswalks before cars make right or left turns. Research suggests that these leading pedestrian intervals can reduce pedestrian-vehicle crashes at intersections by 13%. In addition, the walking indicator could be a default setting instead of requiring pedestrians to press crossing buttons. Default walking indictors could simplify the process for pedestrians and decrease the likelihood of jaywalking.
Another no-cost or even cost-savings strategy is to eliminate painted center lines when repaving neighborhood roads. A recent study showed that drivers drove an average of seven miles per hour slower without a center line on the road. Engineers behind the study speculated that drivers felt more confident on roads with centerlines, thereby causing them to drive faster. Not all roads would be less dangerous without a center lane marking, especially when the roads have higher speed limits and few pedestrians and cyclists. However, removing center lines may be a successful strategy for certain neighborhood streets.
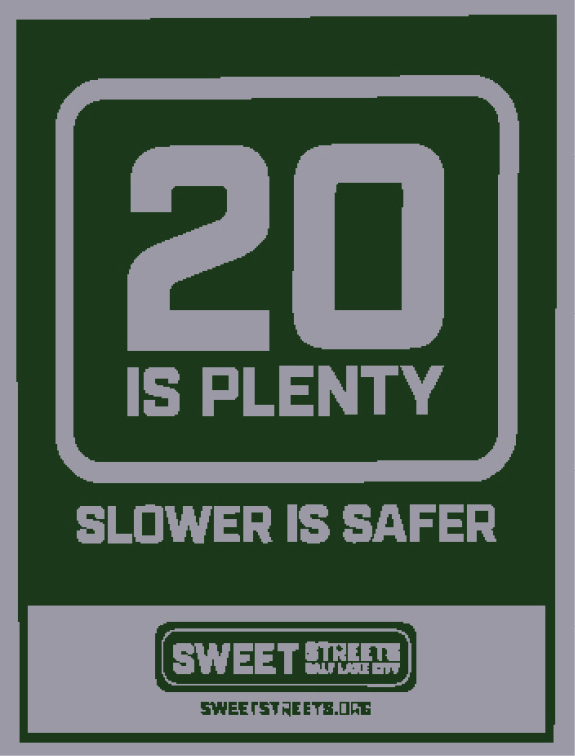
Reducing speed limits, such as Salt Lake City’s “Twenty is Plenty” initiative, can also increase street safety. For example, city and town speed limits could be reduced to 20 miles per hour on non-arterial streets and 25 on arterial streets. Seattle implemented this speed reduction and saw their traffic fatalities decrease by 26%. The World Health Organization also recommends setting speed limits in residential areas between 18 and 25 miles per hour.
Creating variable speed limits to adapt to changes on major roadways such as inclement weather, congestion, crashes, and construction zones, could also increase safety. Studies of variable speed limits on freeways show that they can reduce up to 34% of total crashes, 65% of rear-end crashes, and 51% of fatal and injury crashes. Both major in-town arterial streets and rural main-street highways could utilize this strategy.
Mid-Cost Strategies. A mid-cost strategy for safer streets is to add additional midblock crosswalks to areas that are not well served by the existing traffic pattern. Pedestrians often cross streets regardless of whether there are sufficient and safe midblock crosswalks. Planners could study existing and projected pedestrian volumes and patterns to assess where midblock crosswalks would be the most beneficial. This would not only reduce jaywalking, but this hard infrastructure could slow down traffic – a safety measure in itself.
Another mid-cost strategy is increasing street lighting. Adding streetlighting on roads with frequent crashes can reduce crashes involving pedestrians by about 50%. Lighting makes intersection features visible to cars, cyclists, and pedestrians. A Las Vegas study set up an automatic pedestrian detection device and a smart lighting system at a site where cars often failed to yield to pedestrians and numerous collisions occurred at night. The study showed that vehicles yielded to pedestrians more often with the additional lighting in place. Improved lighting can also help road users feel safer, reduce car crashes, and reduce crime. This perceived personal safety by pedestrians and cyclists could increase usage, yielding positive health benefits and ecological ones.
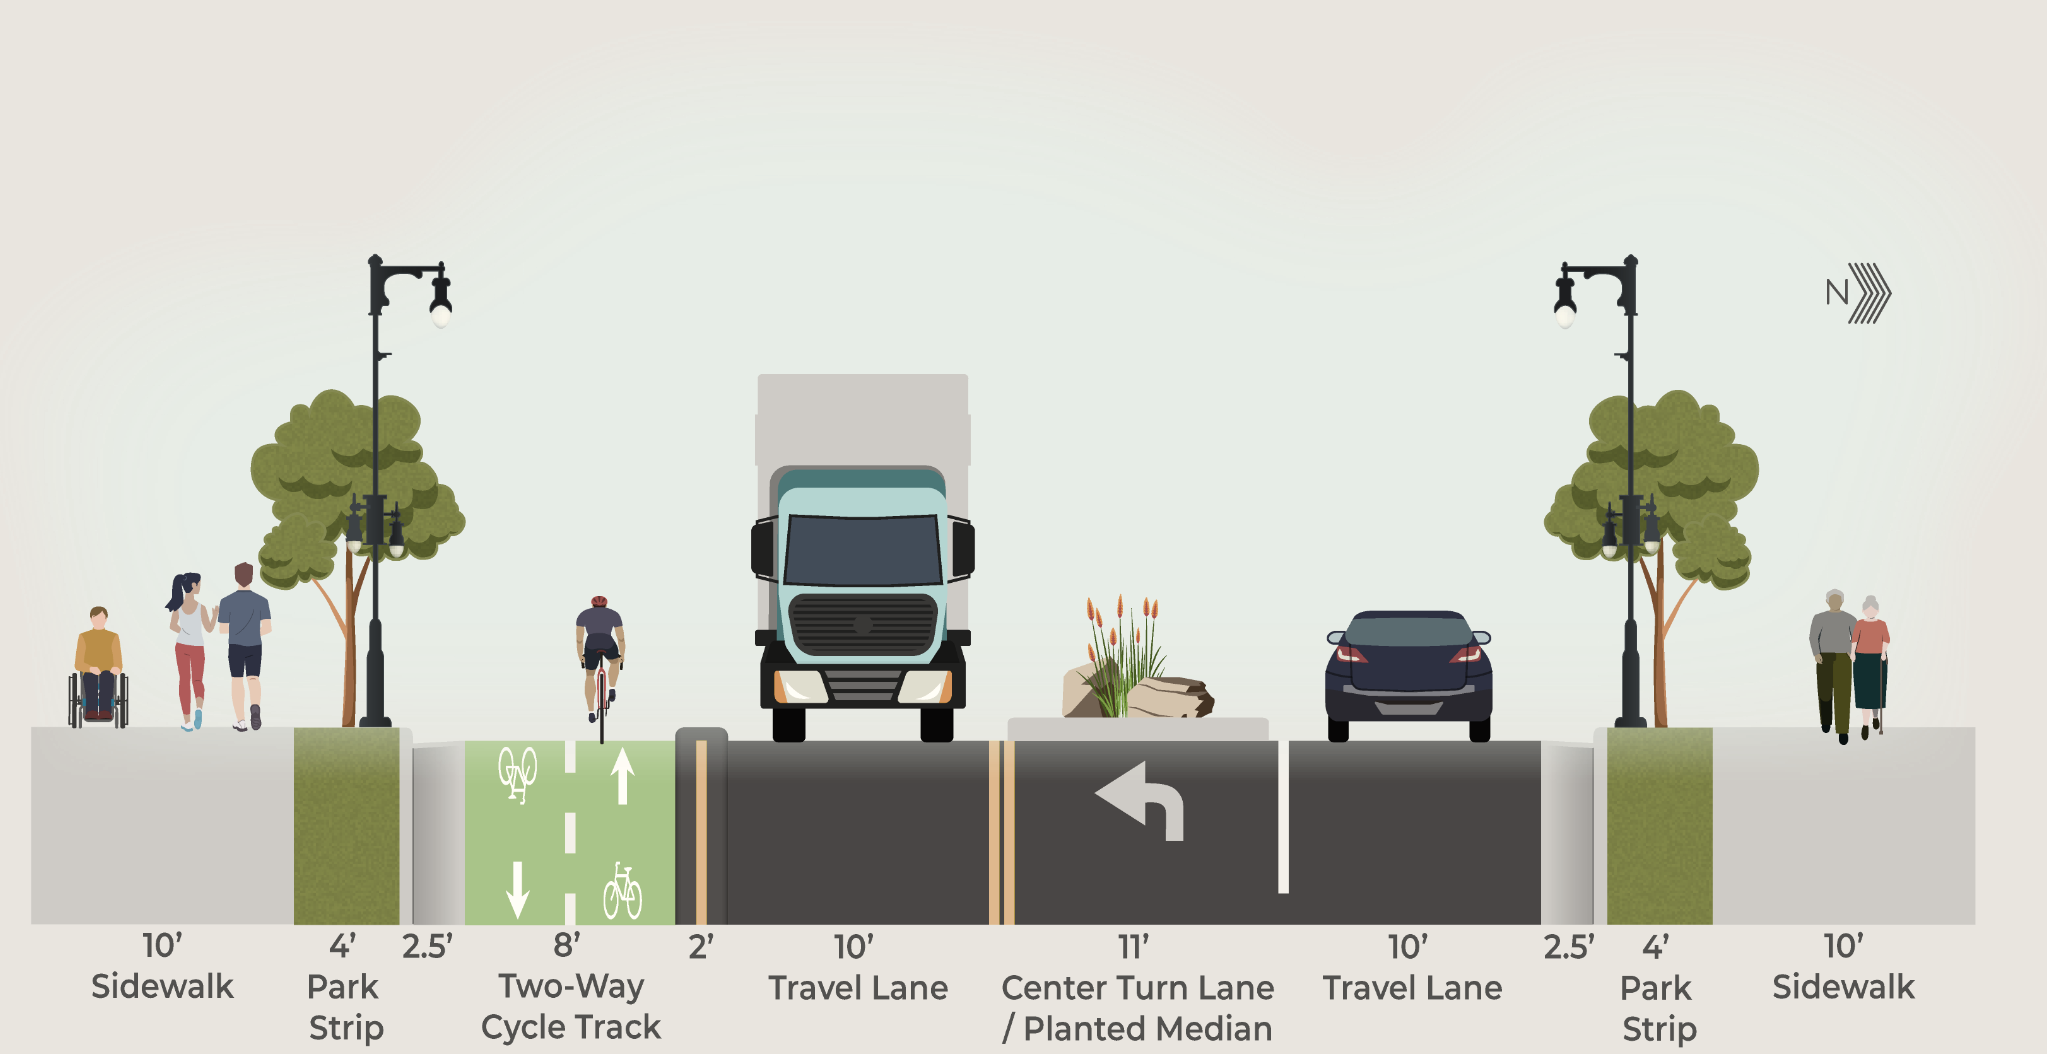
Higher-Cost Strategies. Higher-cost, long-term investments create Complete Streets by narrowing lanes and adding separate bike lanes, on-street parking, park strips with trees and greenery, curb extenders, and similar hard structures. A greater focus on walkable community design should be considered: connected streets, parking behind buildings, and mixed-use, city centers.
For example, lane reductions – or road diets – aim to prioritize all road users rather than simply maximizing a road’s capacity to carry cars. This technique removes at least one lane, using that space for other purposes. A common road diet strategy is turning a four-lane road into two lanes with a shared center lane and bike lanes on either side of the road. Seattle has implemented this road diet configuration with great results; the number of drivers who sped on the road diet streets decreased by 63% and collisions decreased by 23%. There are concerns that this reduces the number of cars that are able to use the roads and increases the time it takes to travel them. However, research suggests this is not the case. Road diets result in only a limited decrease of traffic volume by maintaining efficiency – moving traffic more smoothly through the area.
A road in Utah that seems to be an ideal candidate for a road diet is 2100 South between 700 East and 1300 East in Sugar House. This main artery sees 30,000 cars travel on it every day and the bus route carries 1,500 daily riders, but the road does not work for everyone. Cars are slowed to almost a stop due to a lack of turn lanes. Cyclists are constantly in danger of being hit. Pedestrians walk on narrow sidewalks where they might be hit by bicycles and vehicles. City planners have sought community voices about what they need from this area; those voices are influencing the kind of road calming measures that will be implemented. Construction anticipated to begin in the spring of 2024.
|
“As speed intensifies, so should the hard infrastructure.”
–Chris Wiltsie, Bike Utah
|
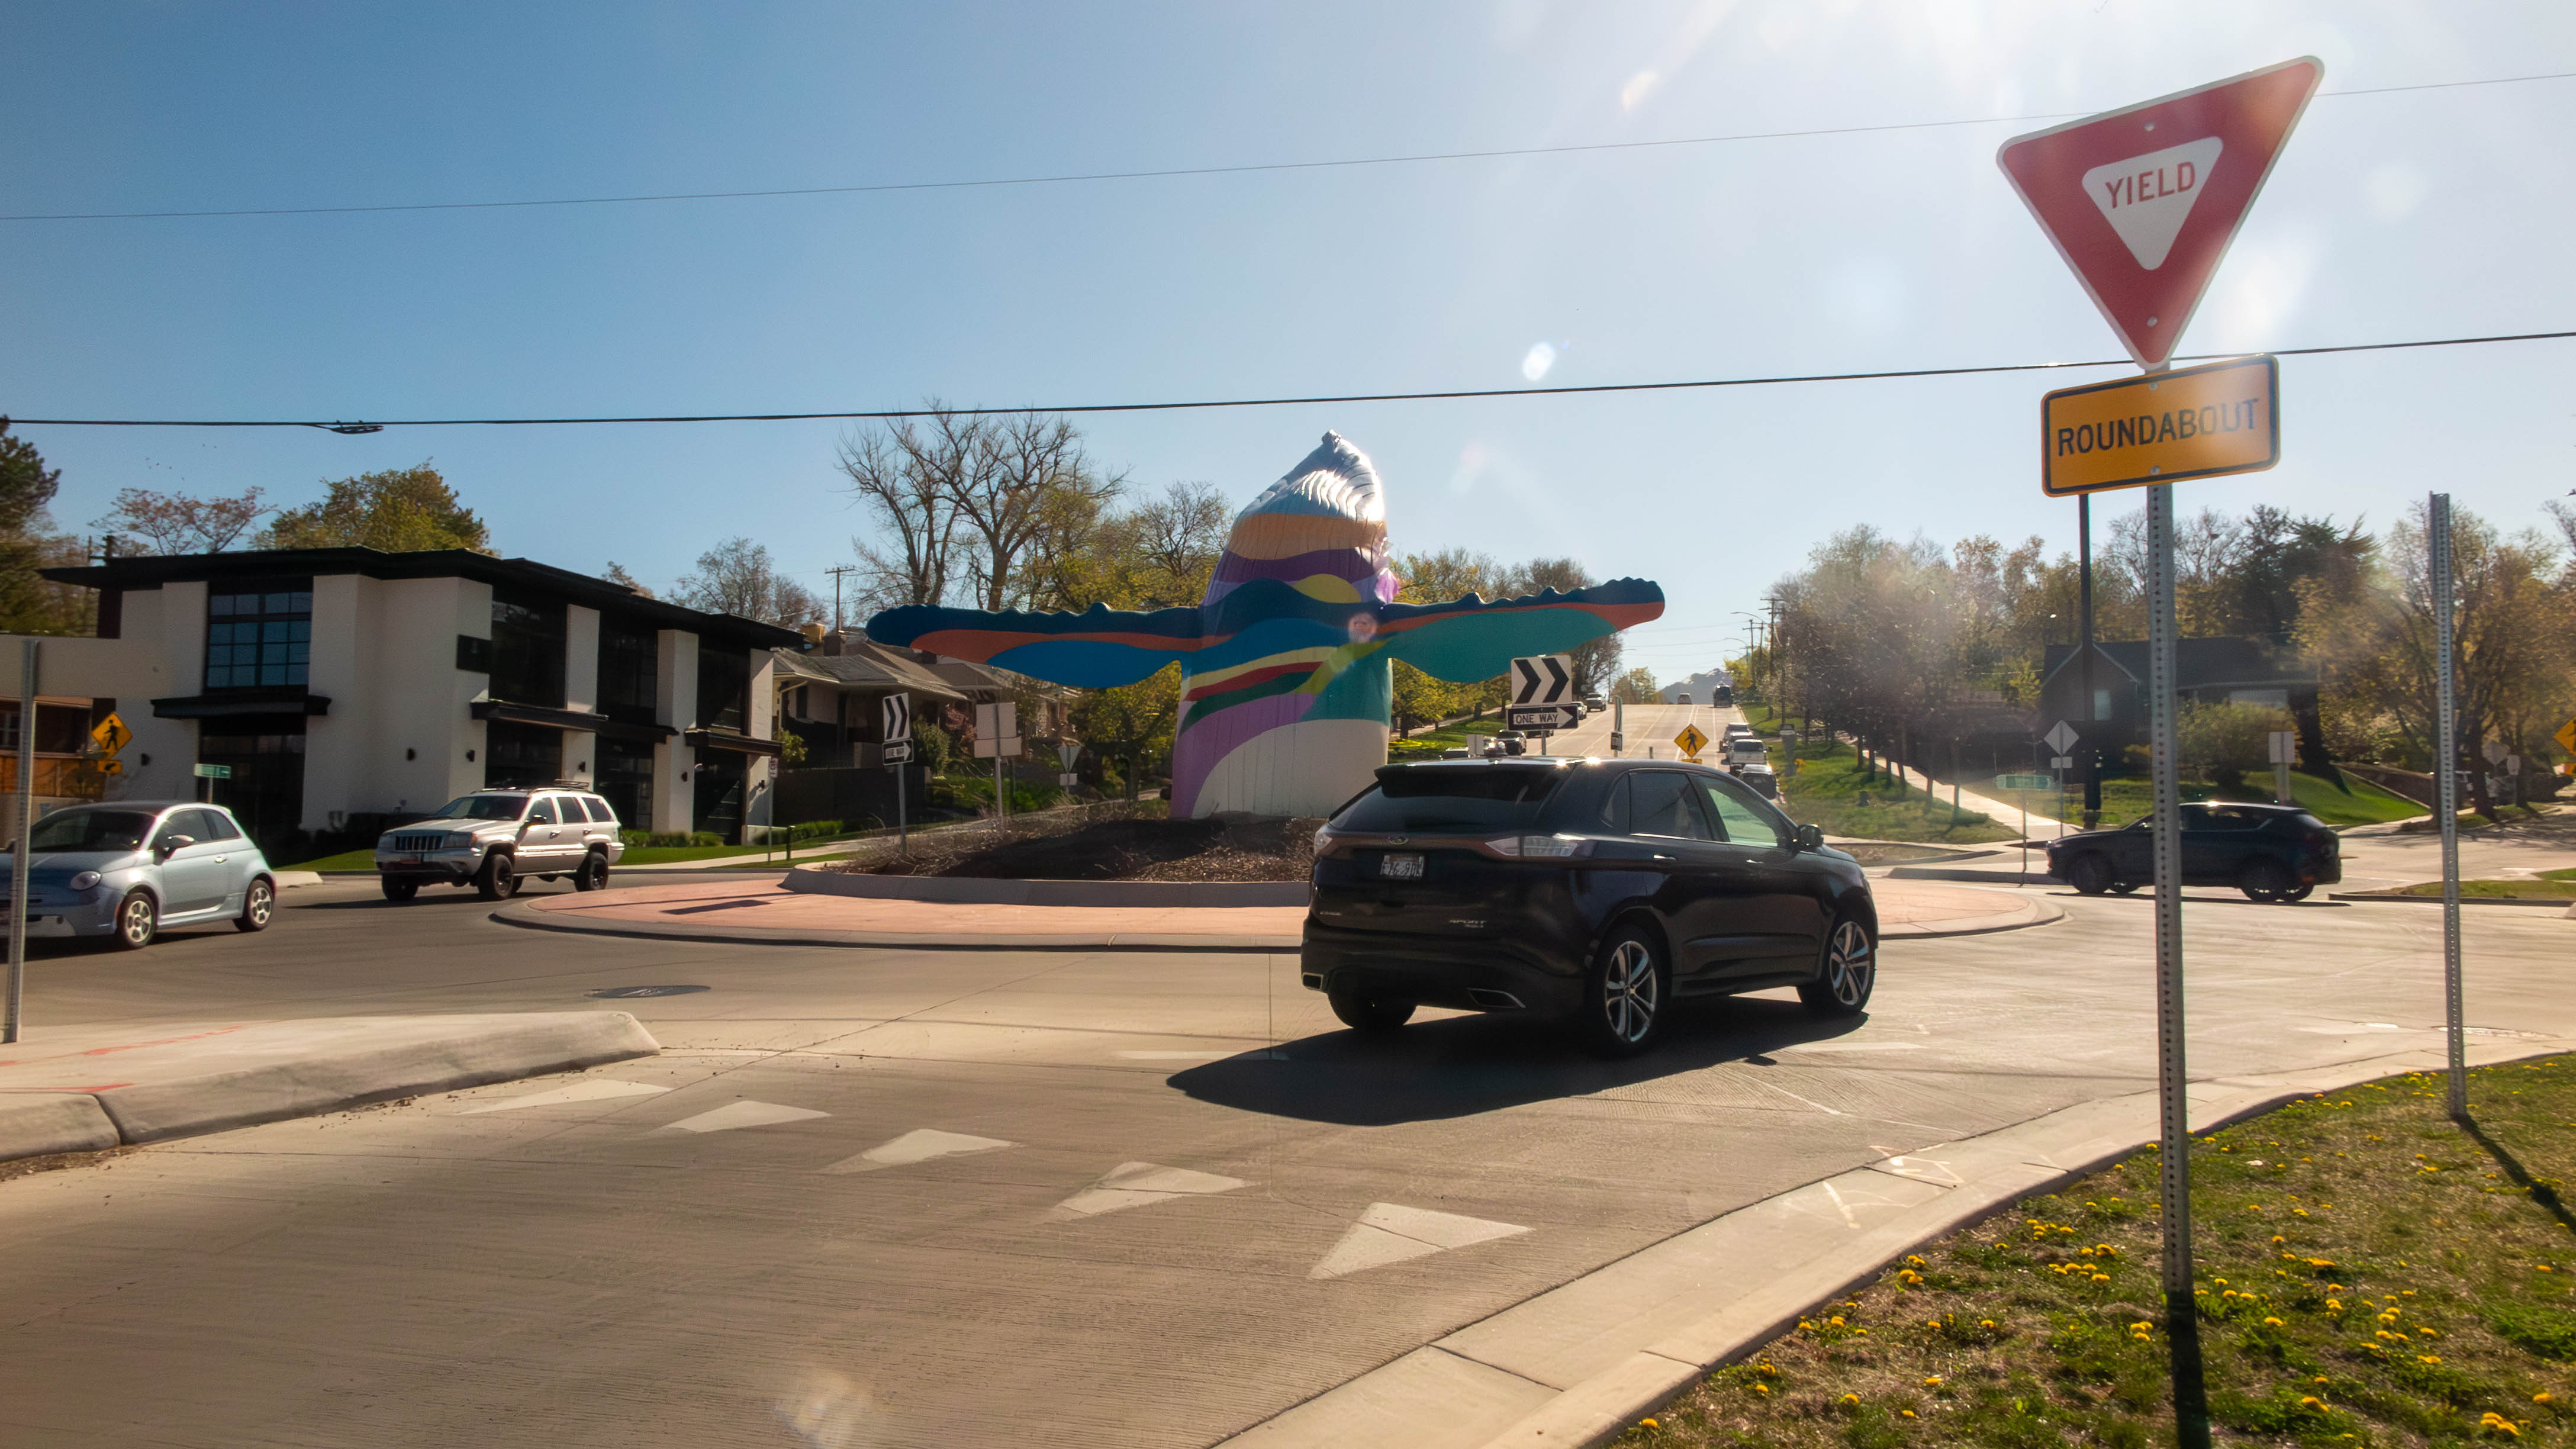
Another long-term investment is adding roundabouts to replace two-way stop intersections that have frequent crashes. Research shows that converting two-way stop intersections into roundabouts reduces fatal crashes and injury crashes by 82%. Additionally, even though roundabouts do require more land than a traditional intersection, they can move 30% to 50% more traffic per lane. Finally, roundabouts reduce air pollution since fewer cars need to stop and idle before accelerating. However, roundabouts can be trickier for pedestrians and especially pedestrians with disabilities to navigate. Research shows that decreasing the speed limit around a roundabout increases safety for cyclists. Single lane roundabouts with a high central island and/or a sperate bike lane are the safest roundabouts for cyclists. Cities and towns need to carefully consider how they can accommodate safe crossings with pedestrian signage and traffic calming measures.
Economic Benefits of Active Transportation
Community leaders cannot always garner required political support implementing policies that increase wellness and safety – there are tradeoffs in every political decision. Policy solutions need to be justified by how they are funded and how they may impact the economy.
In Utah, cycling creates an estimated statewide economic impact of $304 million and creates around 2,000 jobs. Building and maintaining trails play a role in this. For example, the Murdock Canal Trail in Utah County costs $113,000 annually to maintain and contributes over $3.6 million in economic impact. Additionally, the Murdock Canal Trail created 234 construction jobs and an initial $26 million went into the local economy when building the trail.
Over $61 million is spent on bike tourism each year in Utah. However, bike tourism and active transportation do not just impact the economy at large, but also positively affect the real estate market. Research shows that most residents perceive hiking and biking trails as a positive amenity. Home values are therefore shown to benefit when in close proximity to trails. In addition, studies show increased market values for office spaces, retail space, and apartments when there is greater walkability in the surrounding area.
Car dependency encourages suburban malls and urban spread. This type of development can disincentivize small business ownership and is less economically productive as more space is used to move and store cars. In contrast, walkable urban networks may encourage the growth of small local shops, markets, small businesses, and start-up opportunities. Investments in walking environments can attract new businesses and events. In Portland, pedestrian activity increased outside retail stores located along a new streetcar line by 1,000-fold, helping increase the economic value and economic activity in the area. While the streetcar S-line in Salt Lake City is far from its full potential, it has spurred development along the route, in addition to creating an urban trail. The light-rail line connects the center of the valley to the east bench – which is miles away.
Wisconsin researchers studied the effects of Dane County government adding sidewalks to all of its roads. This led to a reduction in motor vehicle miles driven by over one mile per person per day. By dividing the total health and air pollution benefits by the total construction costs, researchers found a benefit-to-cost ratio of nearly two-to-one over a ten-year period. This shows that creating safe, walkable neighborhoods could generate enough economic benefit to make the economic costs justifiable.
Creating hard infrastructure and active transportation amenities requires tax dollars. As with the other zoning measures described above, designing communities with middle housing – or housing that is designed in between single-family housing and large apartment complexes such as duplexes and townhouses – can generate more tax revenue than single family homes. Studies show that housing in walkable developments that are not single-family homes generate 10-times more tax revenue per acre than a typical suburban development. This means that the cost of making communities safer and more walkable can be paid for more quickly with alternative development.
Cities and towns can create Health-in-All-Policies taskforces or committees to help analyze which of these policies make fiscal sense for their community and will be worthwhile. How much a government encourages or mandates a public health discussion is a conversation that each community should have.
Acknowledgement to Community Leaders
This topic is big. This topic is so very important. Thank you to all the community leaders who made it through this report and who are doing this hard work. You truly are saving lives and bettering your community. Thank you for remembering to include health in all of your policies.
Appendix A
Appendix B
Active transportation plans are spread around the state.
Figure B: Cities and Towns in Utah with an Active Transportation Plan, by County in 2023 (Hyperlinked for convienance)
 Source: Utah State University
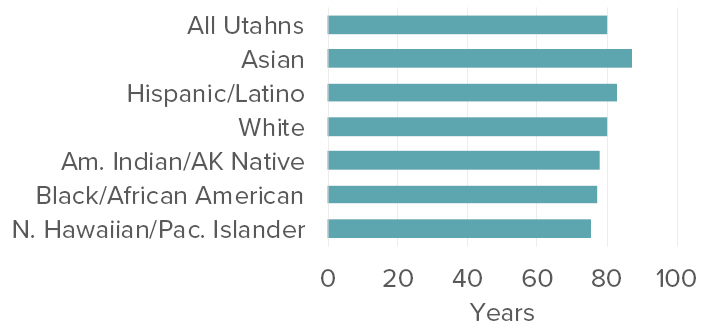

 Source: Salt Lake City
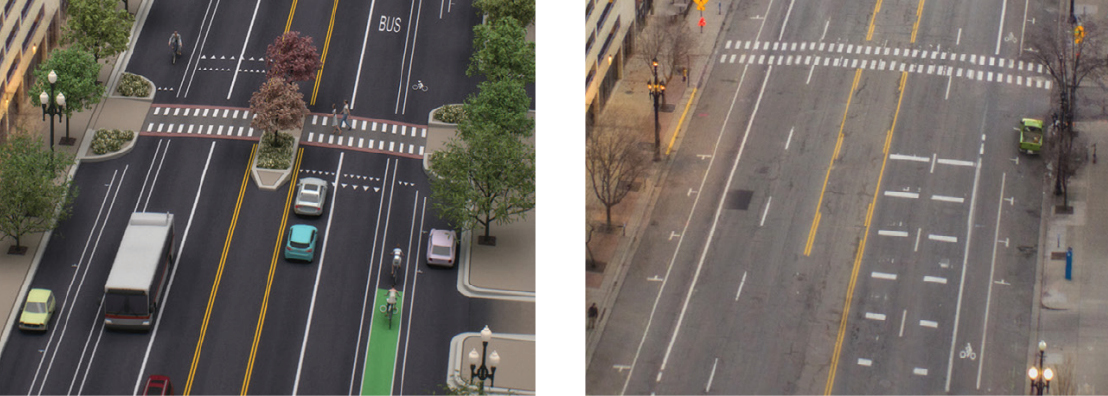
.jpg)